

Introduction
Many startups find themselves at a crossroads, grappling with the challenge of integrating analytics into their user experience design. In today’s fast-paced environment, this integration isn’t just a trend; it’s essential for sustainable growth. Many startups struggle to find the right balance between data and design, often feeling overwhelmed by the complexities involved.
By harnessing data-driven insights, emerging businesses can craft tailored experiences that truly resonate with their audience, ultimately driving engagement and retention. Without this integration, startups risk losing touch with their users, leading to disengagement and stagnation.
This article explores best practices that empower startups to seamlessly integrate analytics into their UX design. By embracing these best practices, startups can not only enhance their user experience but also foster a deeper connection with their audience, paving the way for lasting success.
Define Analytics and User Experience in the Startup Context
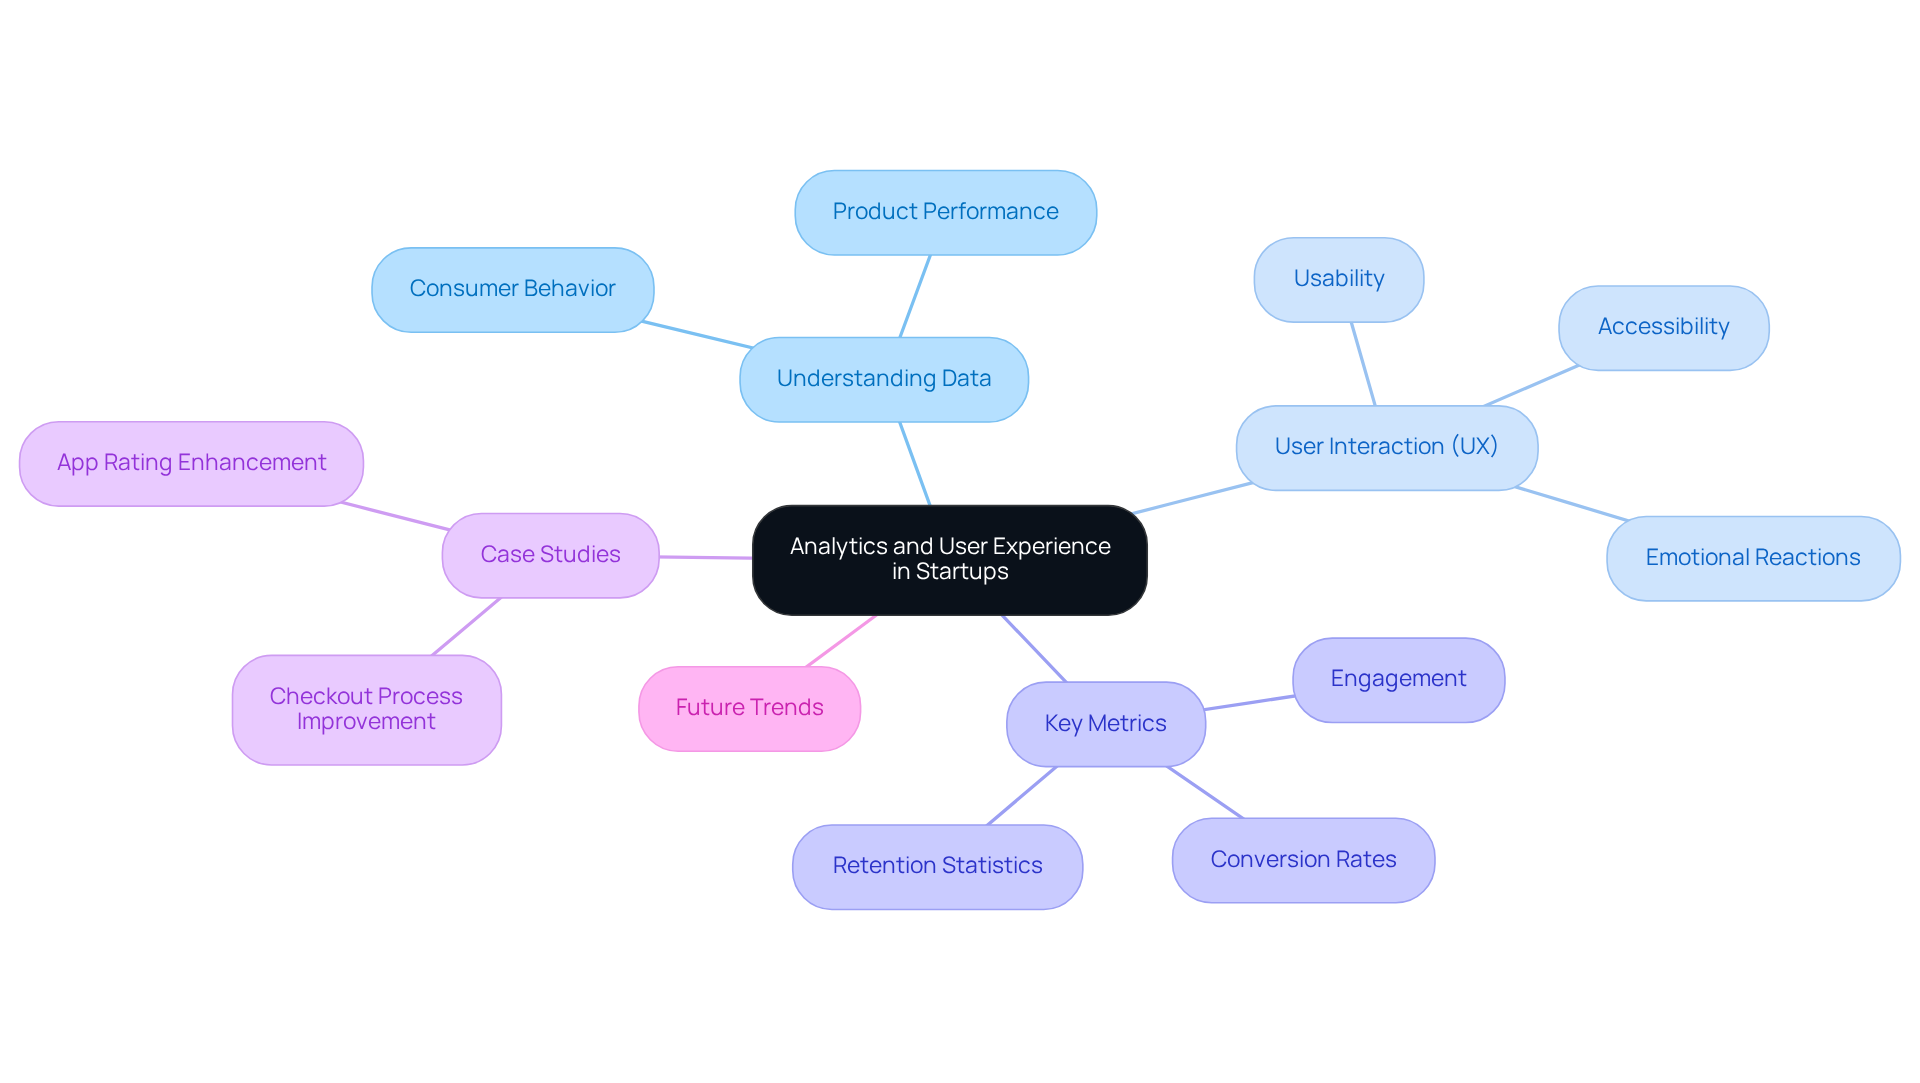
Many startup founders grapple with the overwhelming task of making sense of data, often feeling lost in the numbers that should guide their decisions. In the world of startups, understanding data can feel overwhelming, especially when it comes to making decisions about consumer behavior and product performance. Key metrics like engagement, conversion rates, and retention statistics are vital for grasping how individuals interact with a product.
User interaction (UX) is all about the overall experience someone has when using a product or service. It includes usability, accessibility, and the emotional reactions triggered during the interaction. For emerging businesses, incorporating analytics and user experience into UX design is essential. It helps make informed decisions that improve satisfaction and promote growth. By utilizing insights from consumer behavior data, startups can create customized interactions that address the specific needs of their audience, ultimately leading to increased engagement and retention rates.
One founder shared that after integrating data analysis into their UX strategy, they saw a remarkable 127% return on investment in just three years. This highlights the financial benefits of prioritizing customer satisfaction through informed design decisions.
Case studies further illustrate the impact of data analysis on client experience. For instance, a new business that streamlined its checkout process experienced a 35% increase in conversion rates, showing how addressing friction points can significantly enhance customer satisfaction. Similarly, another emerging business improved its app ratings from 2.5 to 4.8 after redesigning its interface based on user feedback and data insights, demonstrating the transformative power of data-driven design.
As we look ahead, it’s clear that embracing data analysis is essential for startups wanting to connect with their audience and thrive in a fast-paced market. Current statistics show that 80% of companies are incorporating big data insights into their operations, with a projected market growth rate of 28.35% CAGR. This trend emphasizes the importance for emerging businesses to make data analysis a fundamental part of their strategy for enhancing interactions. What steps are you taking to integrate data into your strategy?
In conclusion, the incorporation of data analysis into design for users is not merely advantageous but crucial for emerging businesses striving to succeed. By leveraging data-driven insights, startups can enhance their analytics and user experience while fostering a loyal community that drives sustainable growth.
Identify Key Metrics and Tools for Effective Integration
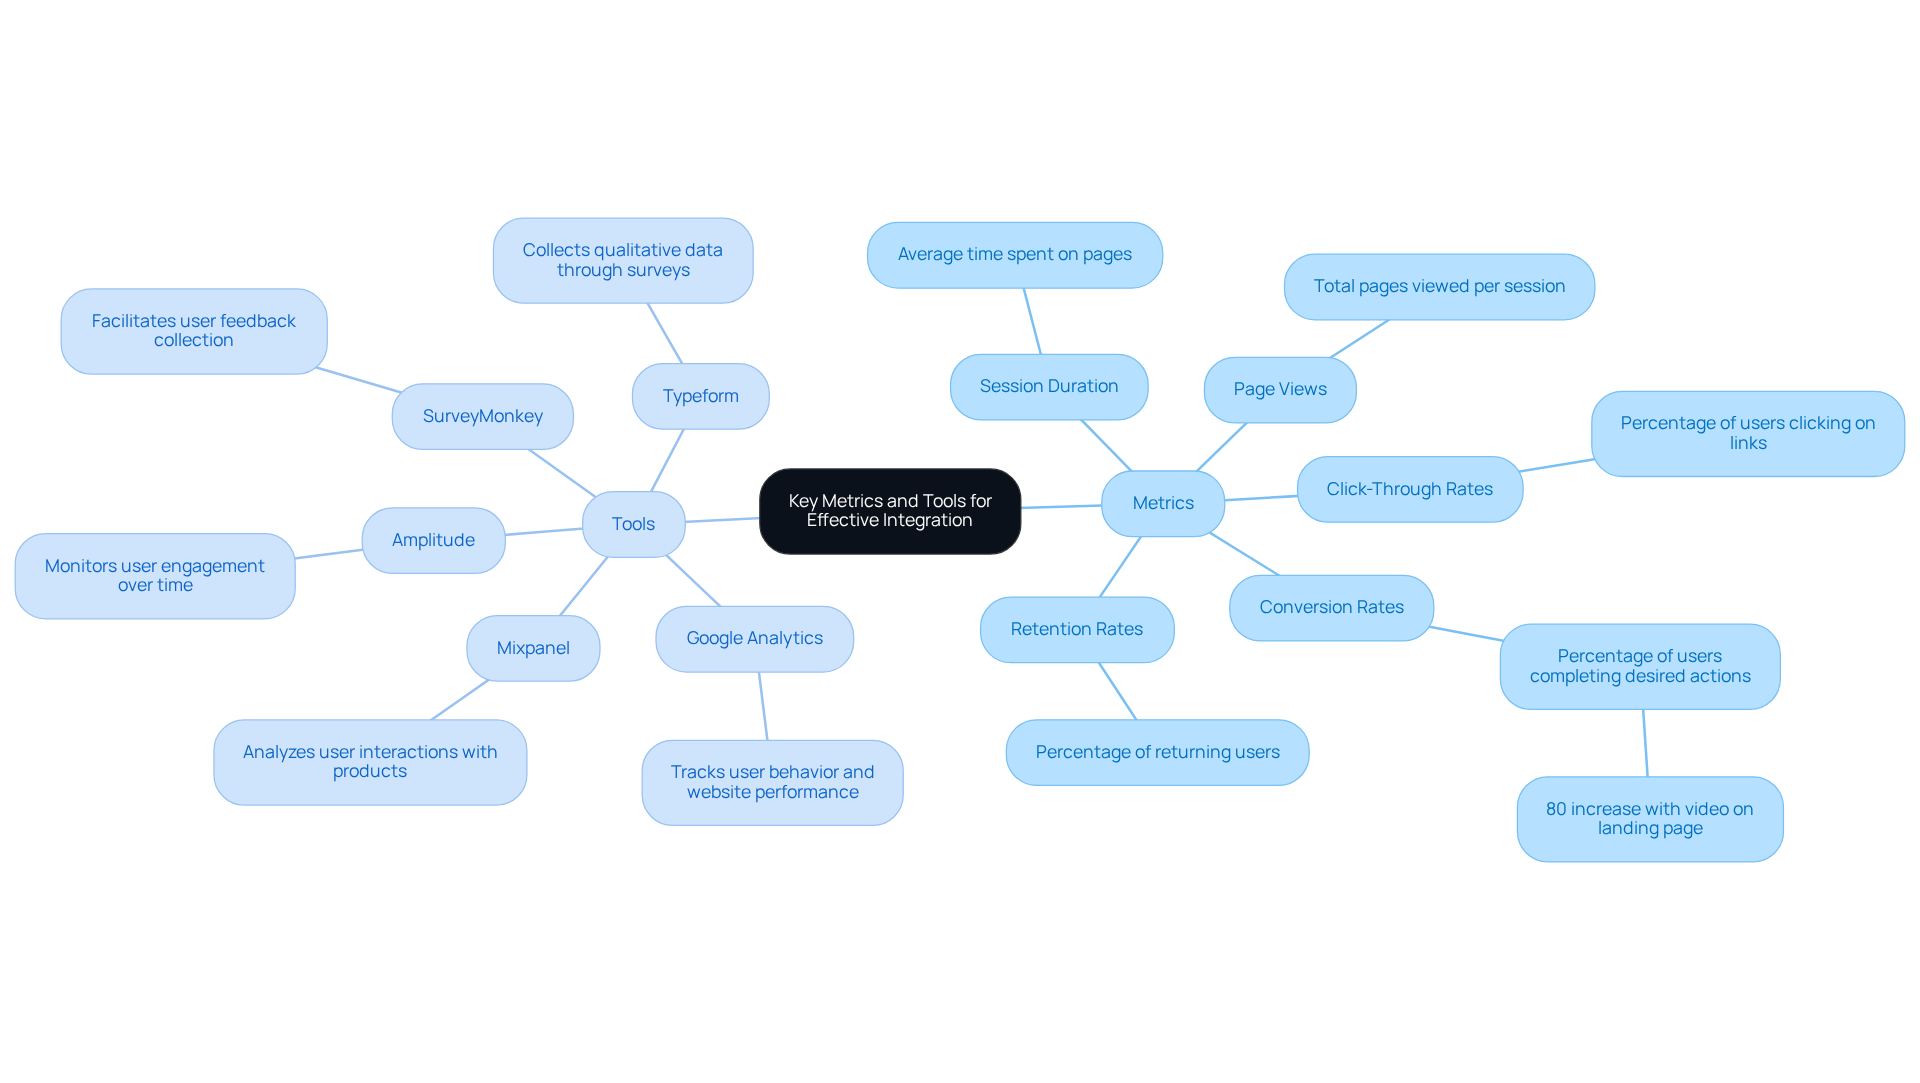
Have you ever wondered why some startups struggle to keep users engaged while others thrive? Monitoring interactions with your product is essential. It’s so important to keep an eye on how users interact with your product. Key indicators include session duration, page views, and click-through rates. Using tools like Google Analytics and Mixpanel can greatly assist in analytics and user experience by helping you understand user behavior, making it easier to improve their experience. Did you know that websites loading in under 3 seconds consistently outperform slower alternatives? This highlights just how crucial speed is for engagement.
Understanding your conversion rates can really help you see how well your interface is working for your users. This metric assesses the percentage of individuals who complete desired actions, such as signing up for a newsletter or making a purchase. For instance, adding a video to your landing page can increase conversion rates by 80%, showcasing the impact of engaging content.
Analyzing how many individuals return after their initial visit is vital. High retention rates often signify a positive experience for participants. Tools like Amplitude can aid in monitoring these metrics over time, enabling adjustments that improve satisfaction among users. Imagine transforming your user experience and seeing your retention rates soar when onboarding processes are optimized.
Collecting qualitative data through surveys and user interviews provides insights into user satisfaction and areas for improvement. Platforms like Typeform and SurveyMonkey facilitate this process, enabling new businesses to gather actionable feedback. As Chris Baldwin, VP of Marketing at Insider One, states, "Activation rate and time to value are the single strongest predictors of early retention."
By using these metrics and tools, you can build a strong framework for analytics and user experience that guides your design choices. This approach not only enhances experiences but also drives better business outcomes, fostering a collaborative environment where RNO1 acts as a partner in navigating the complexities of digital innovation.
Adopt a User-Centered Design Approach Using Analytics
Have you ever poured your heart into a product, only to find it doesn’t resonate with your audience? For many tech startups, this is a common struggle. Understanding your users is not just a nice-to-have; it’s essential for success.
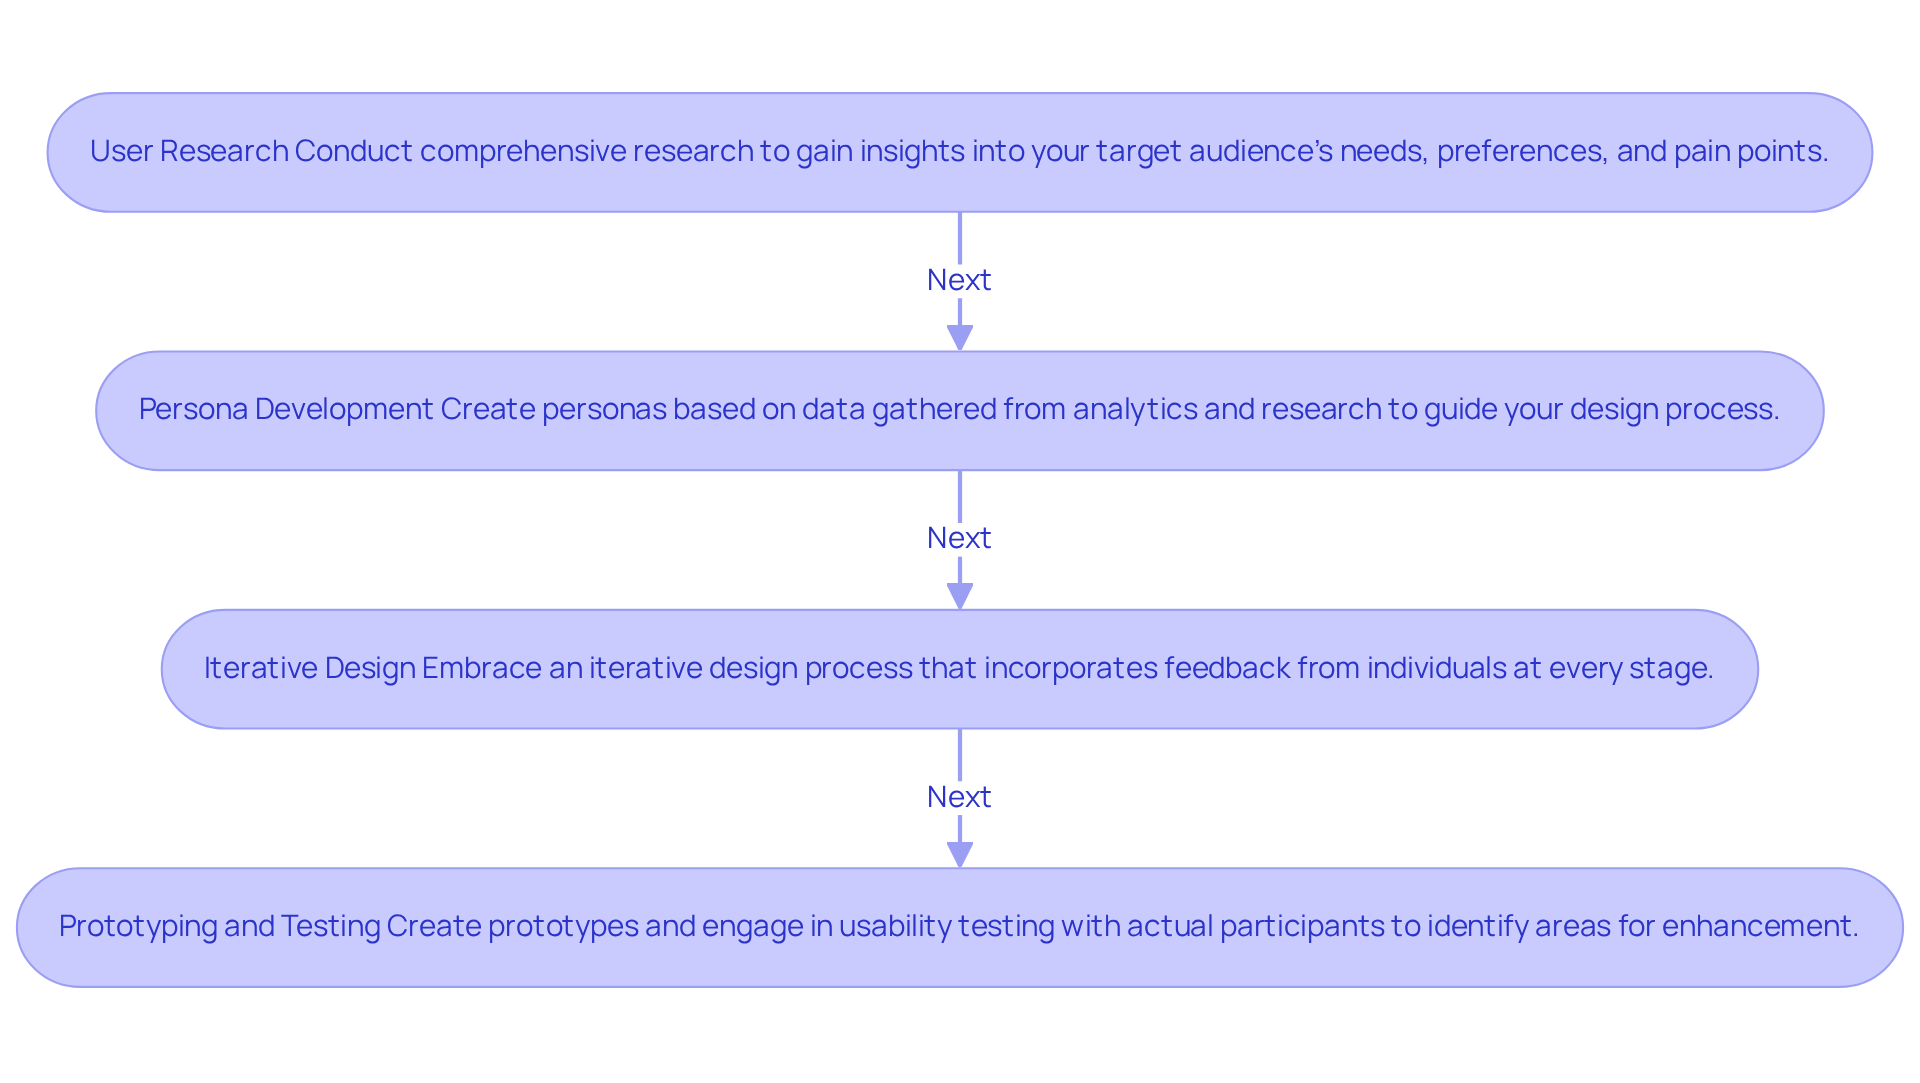
To effectively adopt a user-centered design approach, tech startups should implement the following best practices:
- User Research: Conduct comprehensive research to gain insights into your target audience's needs, preferences, and pain points. Imagine being part of a team that truly understands its customers; data-driven organizations often find that they build loyalty nine times more effectively than those who don’t. By diving deep into user behavior, you can make informed design choices that resonate.
- Persona Development: Create personas based on data gathered from analytics and research. These personas should represent your ideal audience, guiding your design process and ensuring alignment with their expectations. Think of them as your user’s voice, helping you stay connected to their needs.
- Iterative Design: Embrace an iterative design process that incorporates feedback from individuals at every stage. When companies weave research into their product development, they often see a remarkable 30%-70% boost in their business metrics, showing just how vital it is to listen to your users! This ongoing dialogue fosters improvement and enhances the experience for everyone involved.
- Prototyping and Testing: Create prototypes of your product and engage in usability testing with actual participants. Examine the information collected during testing to identify areas for enhancement, ultimately improving the overall experience for users. Remember, designing in isolation can lead to misaligned products that don’t fulfill the needs of those who will use them.
By incorporating analytics and user experience into a design framework focused on the end user, emerging businesses can create products that not only meet consumer needs but also enhance engagement and satisfaction, promoting long-term success. By prioritizing user-centered design, you’re not just creating a product; you’re building a community that truly understands and values your vision.
Implement Continuous Testing and Refinement of User Experiences
Are you feeling overwhelmed by the challenge of keeping your users engaged? Many startups find it challenging to keep their users engaged and satisfied, often leading to frustration and lost opportunities. To create a dynamic user experience that evolves alongside your audience, consider implementing continuous testing and refinement strategies.
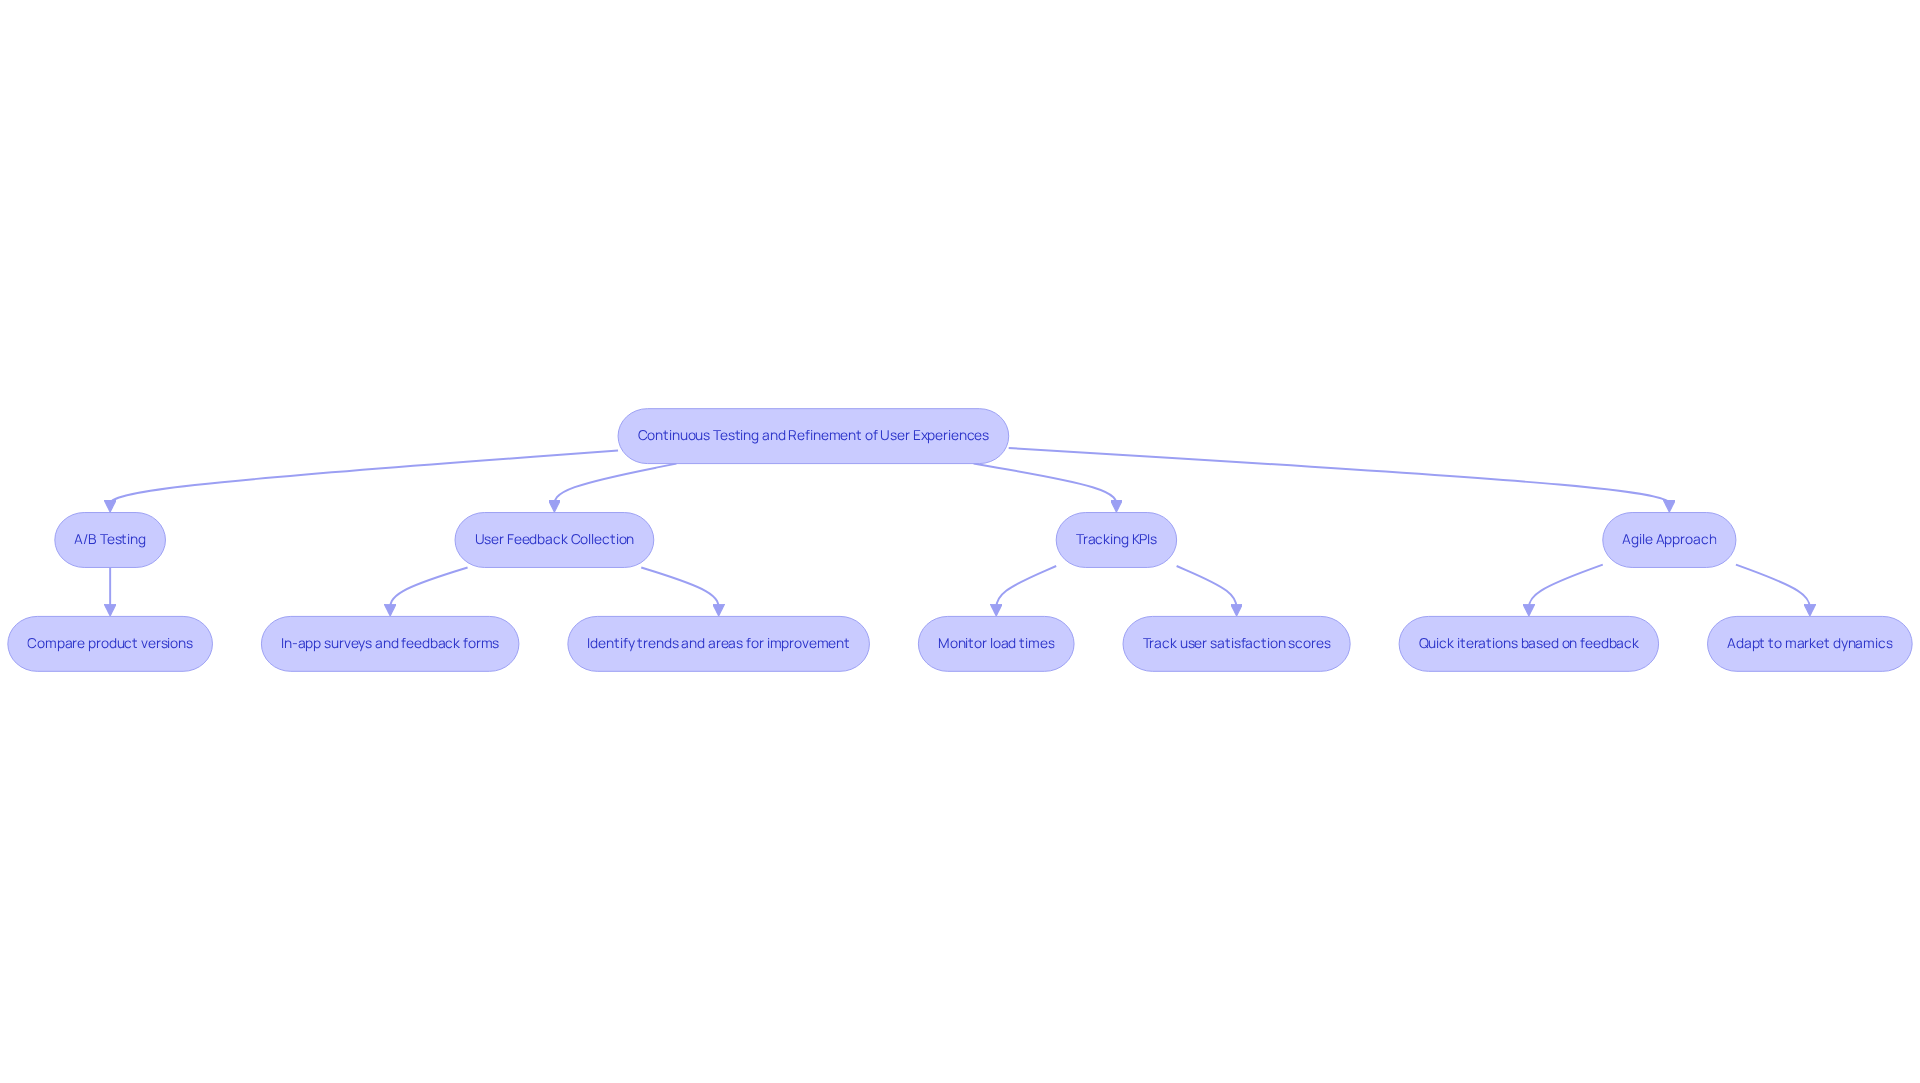
Have you tried A/B testing to see which version of your product resonates best with your users? Regularly performing A/B tests can help you compare different versions of your product and determine which design elements truly connect with your audience. Utilize analytics and user experience to track performance metrics and make data-driven decisions that enhance user satisfaction.
What if you set up in-app surveys or feedback forms to gather insights from your users continuously? Establishing mechanisms for collecting feedback can help you identify trends and areas for improvement, ensuring that your product aligns with user needs.
Are you keeping an eye on key performance indicators like load times and user satisfaction scores? Continuously tracking these KPIs related to analytics and user experience allows you to monitor performance over time and make necessary adjustments.
Have you considered adopting an agile approach to quickly adapt your product based on user feedback? Embracing an agile strategy for product development enables swift iterations, allowing your startup to react promptly to evolving client requirements and market dynamics.
By embracing these strategies, startups can transform their user experience, turning frustration into loyalty and satisfaction, fostering long-term engagement and community around your brand.
Conclusion
Many startups find themselves overwhelmed by competition, unsure of how to stand out and connect with their audience. Integrating analytics with user experience is not just a strategy; it’s a fundamental necessity for startups aiming to thrive in competitive markets. By understanding and leveraging data, emerging businesses can create tailored experiences that resonate with their audience, ultimately driving engagement and fostering loyalty. The synergy between analytics and user experience empowers startups to make informed decisions that enhance customer satisfaction and promote sustainable growth.
Throughout this article, we’ve highlighted key practices, including:
- Defining analytics and user experience
- Identifying essential metrics and tools
- Adopting a user-centered design approach
- Implementing continuous testing and refinement
Each of these elements plays a crucial role in shaping a product that not only meets user needs but also adapts to their evolving preferences. Real-world examples demonstrate how startups have successfully transformed their user experiences through data-driven insights, leading to significant improvements in engagement and conversion rates.
As the landscape of digital innovation continues to evolve, the call to action is clear: startups must prioritize the integration of analytics and user experience in their strategies. By embracing a collaborative approach and leveraging the expertise of partners like RNO1, businesses can navigate the complexities of user-centered design and analytics, ensuring they remain agile and responsive to market demands. Investing in this integration is not just a choice; it's a commitment to your customers that will shape your startup's future success.
Frequently Asked Questions
What is the relationship between analytics and user experience (UX) in the startup context?
In the startup context, analytics and user experience are interconnected as understanding data helps inform design decisions that enhance user satisfaction. Key metrics like engagement, conversion rates, and retention statistics are vital for grasping how users interact with a product, ultimately leading to improved UX.
Why is it important for startups to incorporate analytics into their UX design?
Incorporating analytics into UX design is essential for startups because it allows them to make informed decisions that improve customer satisfaction and promote growth. By utilizing insights from consumer behavior data, startups can create customized interactions that address the specific needs of their audience.
Can you provide an example of how data analysis has benefited a startup's UX strategy?
One founder reported a remarkable 127% return on investment after integrating data analysis into their UX strategy over three years. This demonstrates the financial benefits of prioritizing customer satisfaction through informed design decisions.
What impact can data analysis have on conversion rates for startups?
Data analysis can significantly impact conversion rates. For example, a new business that streamlined its checkout process experienced a 35% increase in conversion rates, highlighting how addressing friction points can enhance customer satisfaction.
How can user feedback and data insights transform a startup's product ratings?
User feedback and data insights can lead to substantial improvements in product ratings. For instance, one emerging business improved its app ratings from 2.5 to 4.8 after redesigning its interface based on user feedback and data analysis, showcasing the transformative power of data-driven design.
What is the current trend regarding the use of big data in companies?
Currently, 80% of companies are incorporating big data insights into their operations, with a projected market growth rate of 28.35% CAGR. This trend emphasizes the importance for emerging businesses to integrate data analysis into their strategies for enhancing user interactions.
What steps should startups take to integrate data into their strategy?
Startups should prioritize incorporating data analysis into their design processes, focusing on understanding consumer behavior and leveraging insights to enhance user experience. This approach is crucial for building a loyal community and driving sustainable growth.
List of Sources
- Define Analytics and User Experience in the Startup Context
- The Most Important UX Statistics in 2026: Business Impact, Benchmarks & Growth Levers (https://designrush.com/agency/ui-ux-design/trends/ui-ux-statistics)
- Data Analytics Statistics: Key Trends and Figures (https://edgedelta.com/company/knowledge-center/data-analytics-statistics)
- 50+ UX Statistics To Convince Stakeholders 2025 (https://uxcam.com/blog/ux-statistics)
- 10 Data Analytics Stats SMBs Need for 2026 (https://impactmybiz.com/blog/data-analytics-stats-for-smbs)
- Data Analytics Statistics 2026 | Latest Insights & Trends (https://data.folio3.com/blog/data-analytics-stats)
- Identify Key Metrics and Tools for Effective Integration
- 43 Conversion Rate Optimization Statistics [2026] | Wingify (https://wingify.com/conversion-rate-optimization/conversion-rate-optimization-statistics)
- 7 Customer Engagement Metrics Brands Should Track in 2026 (https://insiderone.com/customer-engagement-metrics)
- 30 Conversion Rate Statistics That Define Modern Business Performance | Landbase (https://landbase.com/blog/conversion-rate-statistics)
- Top 10 customer engagement metrics to measure in 2026 (https://zendesk.com/blog/customer-experience/engagement/customer-engagement-actually-means/4-customer-engagement-metrics-measure)
- Adopt a User-Centered Design Approach Using Analytics
- Best 50+ UX statistics for 2026 (https://blog.uxtweak.com/ux-statistics)
- 40+ Key UX Stats for 2026 (https://maze.co/blog/ux-statistics)
- 14 UX Statistics to Prove that Design Matters (https://eleken.co/blog-posts/14-impressive-ux-statistics-to-prove-the-value-of-great-design)
- User-Centered Design Statistics Guide for 2026 (https://linkedin.com/pulse/user-centered-design-statistics-2026-mastercrmua-5ulaf)
- User-Centered Design Statistics 2026: ROI, Process & Best Practices (https://gloriumtech.com/user-centered-design-guide)
- Implement Continuous Testing and Refinement of User Experiences
- A/B testing adoption, win rate, and impact statistics (2026) | STARTUP EDITION (https://blog.mean.ceo/ab-testing-adoption-win-rate-impact-statistics)
- 30 Key A/B Testing Statistics: A Comprehensive Guide | Wingify (https://wingify.com/blog/ab-testing-statistics)
- 12 A/B testing & experimentation stats you need to know in 2026 | Kameleoon (https://kameleoon.com/blog/a-b-testing-experimentation-stats-you-need-to-know)
- 5 Employee Feedback Stats That You Need to See (https://linkedin.com/business/talent/blog/talent-strategy/employee-feedback-stats-you-need-to-see)
- User Feedback Loop: How to Close It Effectively | Mouseflow (https://mouseflow.com/blog/user-feedback-loop)


