Overview
Many tech startup founders struggle to make sense of their website traffic, feeling overwhelmed by the sheer volume of data available. This confusion can lead to missed opportunities for user engagement and growth. Without a clear understanding of user behavior, it’s challenging to make informed decisions that drive conversions and business success.
However, there is a way to navigate this complexity. By focusing on four key practices, you can transform how you analyze website traffic:
- Define key metrics that matter most to your business.
- Implement analytics tools that will help you gather meaningful insights.
- Analyze the data thoughtfully, allowing it to inform your strategic decisions.
- Monitor and adjust your strategies based on these insights for ongoing success.
These practices not only provide a structured approach to understanding user behavior but also empower you to make data-informed decisions. As you embrace this journey, you’ll find that enhancing user engagement and optimizing your online strategies becomes more achievable. Remember, you’re not alone in this; many have walked this path and emerged stronger, equipped with the knowledge to drive their startups forward.
Introduction
Understanding website traffic can feel overwhelming for many tech startup founders. In a competitive digital landscape, the pressure to thrive is immense. It’s not just about attracting visitors; it’s about engaging and converting them into loyal customers. This challenge can often leave founders feeling lost amidst the data. However, there is hope. By honing in on key metrics and utilizing the right analytics tools, you can transform that overwhelming data into actionable insights that guide your strategic decisions.
This article explores four essential practices designed to empower you to navigate the complexities of website traffic analysis, helping you unlock your startup's full potential. Together, we can turn these challenges into stepping stones for success.
Define Key Metrics for Website Traffic Analysis
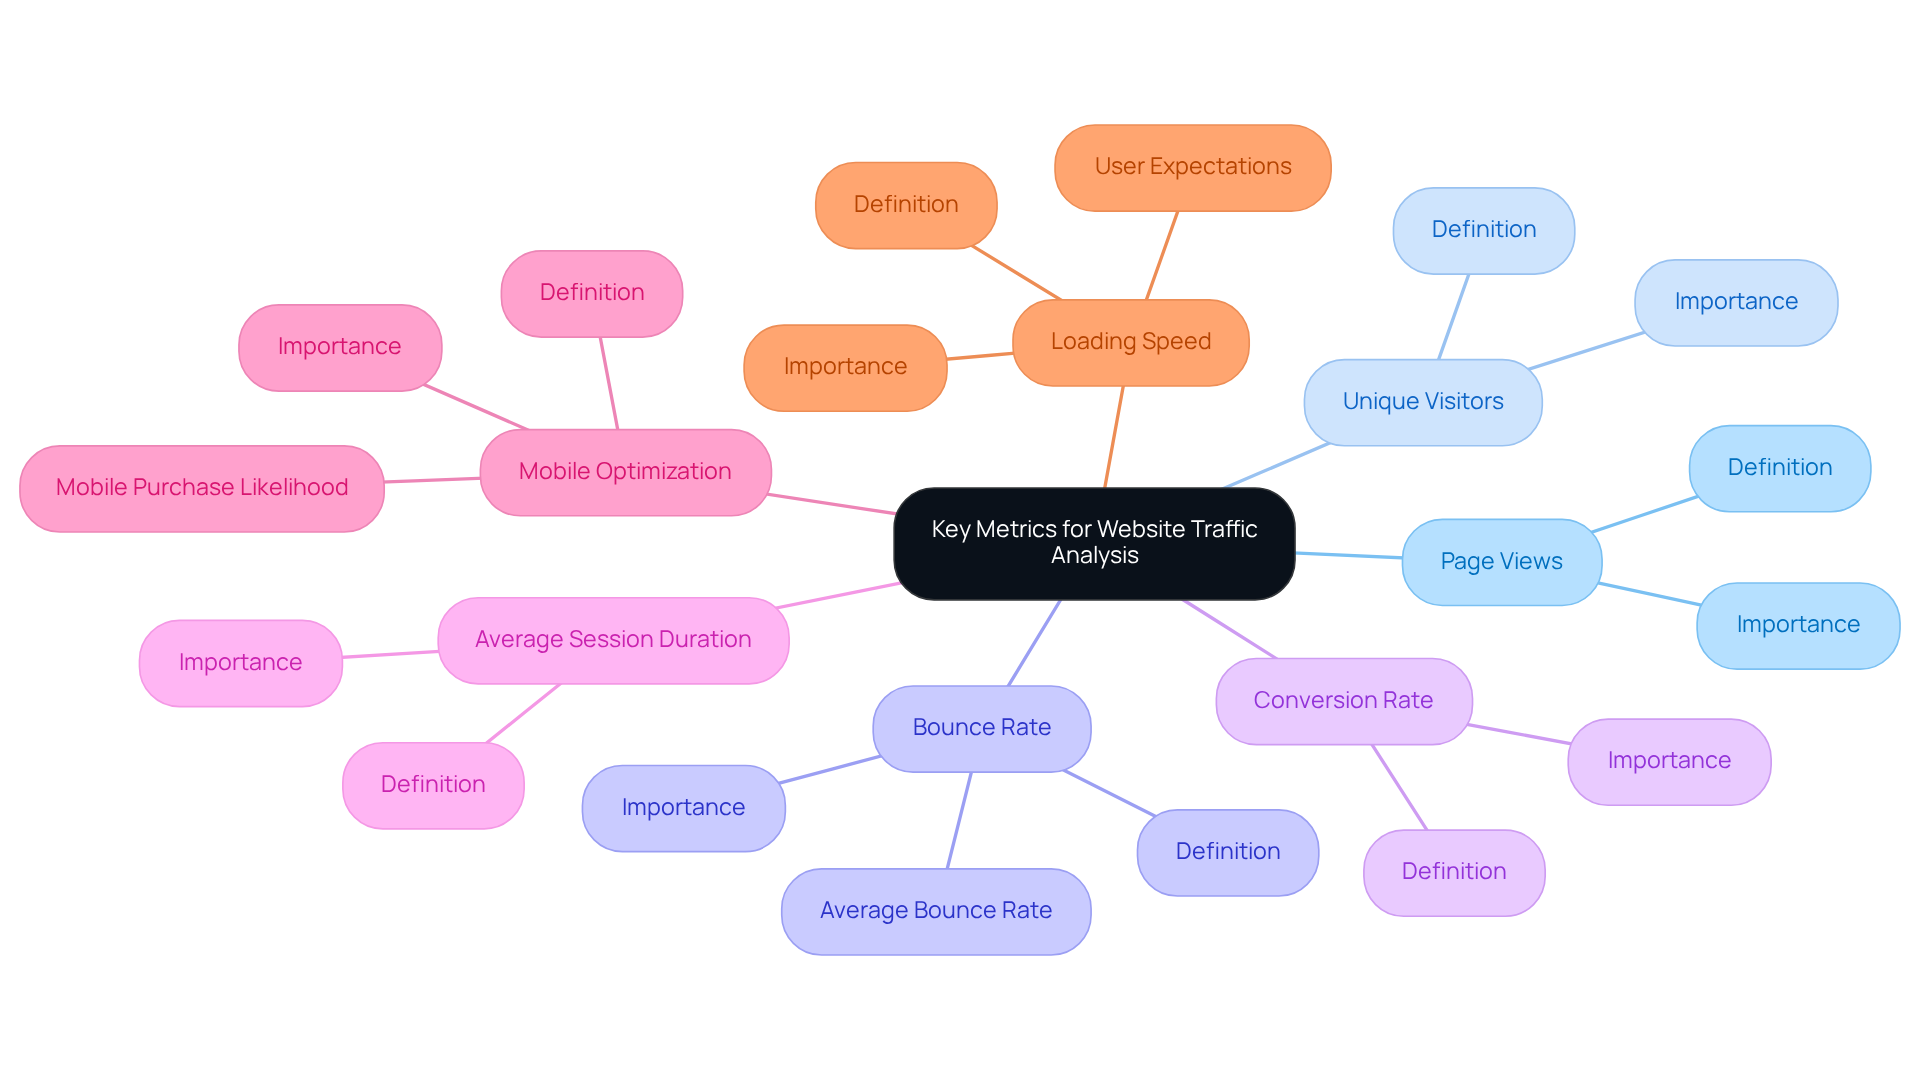
To effectively conduct an analysis of website traffic, it's essential to define key metrics that resonate with your business objectives. Many tech startup founders face the challenge of understanding user engagement, which can feel overwhelming. However, by focusing on specific metrics, you can enhance your online strategy and create a more fulfilling experience for your users.
- Page Views: This metric represents the total number of pages viewed on your site, serving as an indicator of overall engagement and interest in your content. It’s a starting point for understanding how users interact with your offerings.
- Unique Visitors: Counting distinct individuals visiting your site provides insight into your reach and audience size. For tech startups, this number can vary significantly; eCommerce sites average around 24,572 unique visitors per month. Recognizing this can help you appreciate the breadth of your audience.
- Bounce Rate: This percentage indicates the visitors who exit after viewing just one page, signaling potential issues with content relevance or experience. The average bounce rate typically ranges from 41% to 55%, suggesting that many visitors do not engage further. Notably, 88% of internet visitors won’t revisit a site following a negative experience. This highlights the importance of enhancing your content to keep users engaged.
- Conversion Rate: This metric measures the percentage of visitors who complete desired actions, such as signing up for a newsletter or making a purchase. Improving your conversion rate can often be achieved by enhancing the user experience rather than simply increasing traffic. As one industry leader wisely noted, "It's much easier to double your business by doubling your conversion rate than by doubling your traffic."
- Average Session Duration: This indicates the average time visitors spend on your site, reflecting their engagement levels. Users typically spend about 54 seconds on a single page, underscoring the need for captivating content that holds their attention.
- Mobile Optimization: With 67% of individuals more inclined to make a purchase on a mobile-friendly platform, ensuring your site is optimized for mobile devices is crucial for improving user experience and driving conversions.
- Loading Speed: Almost half of visitors will not wait longer than two seconds for a page to load, making speed a vital element for retention and engagement.
By concentrating on these metrics, you can cultivate strategies that enhance client experience and drive conversions effectively, aided by the analysis of website traffic. Remember, focusing on user-centric approaches and quality content is vital for achieving sustainable growth in today’s competitive landscape. You’re not alone in this journey; many have walked this path and found success by prioritizing the needs of their users.

Implement Analytics Tools for Data Collection
Navigating the world of online visitor data can feel overwhelming for many tech startup founders. The challenge of efficiently gathering and examining this data often leads to frustration and missed opportunities. Without the right analytics tools, the analysis of website traffic, user behavior, traffic sources, and conversion metrics may be difficult, which are essential for making informed decisions.
Imagine the difference it could make if you had access to powerful tools that not only simplify this process but also provide valuable insights. Here are some highly recommended options:
-
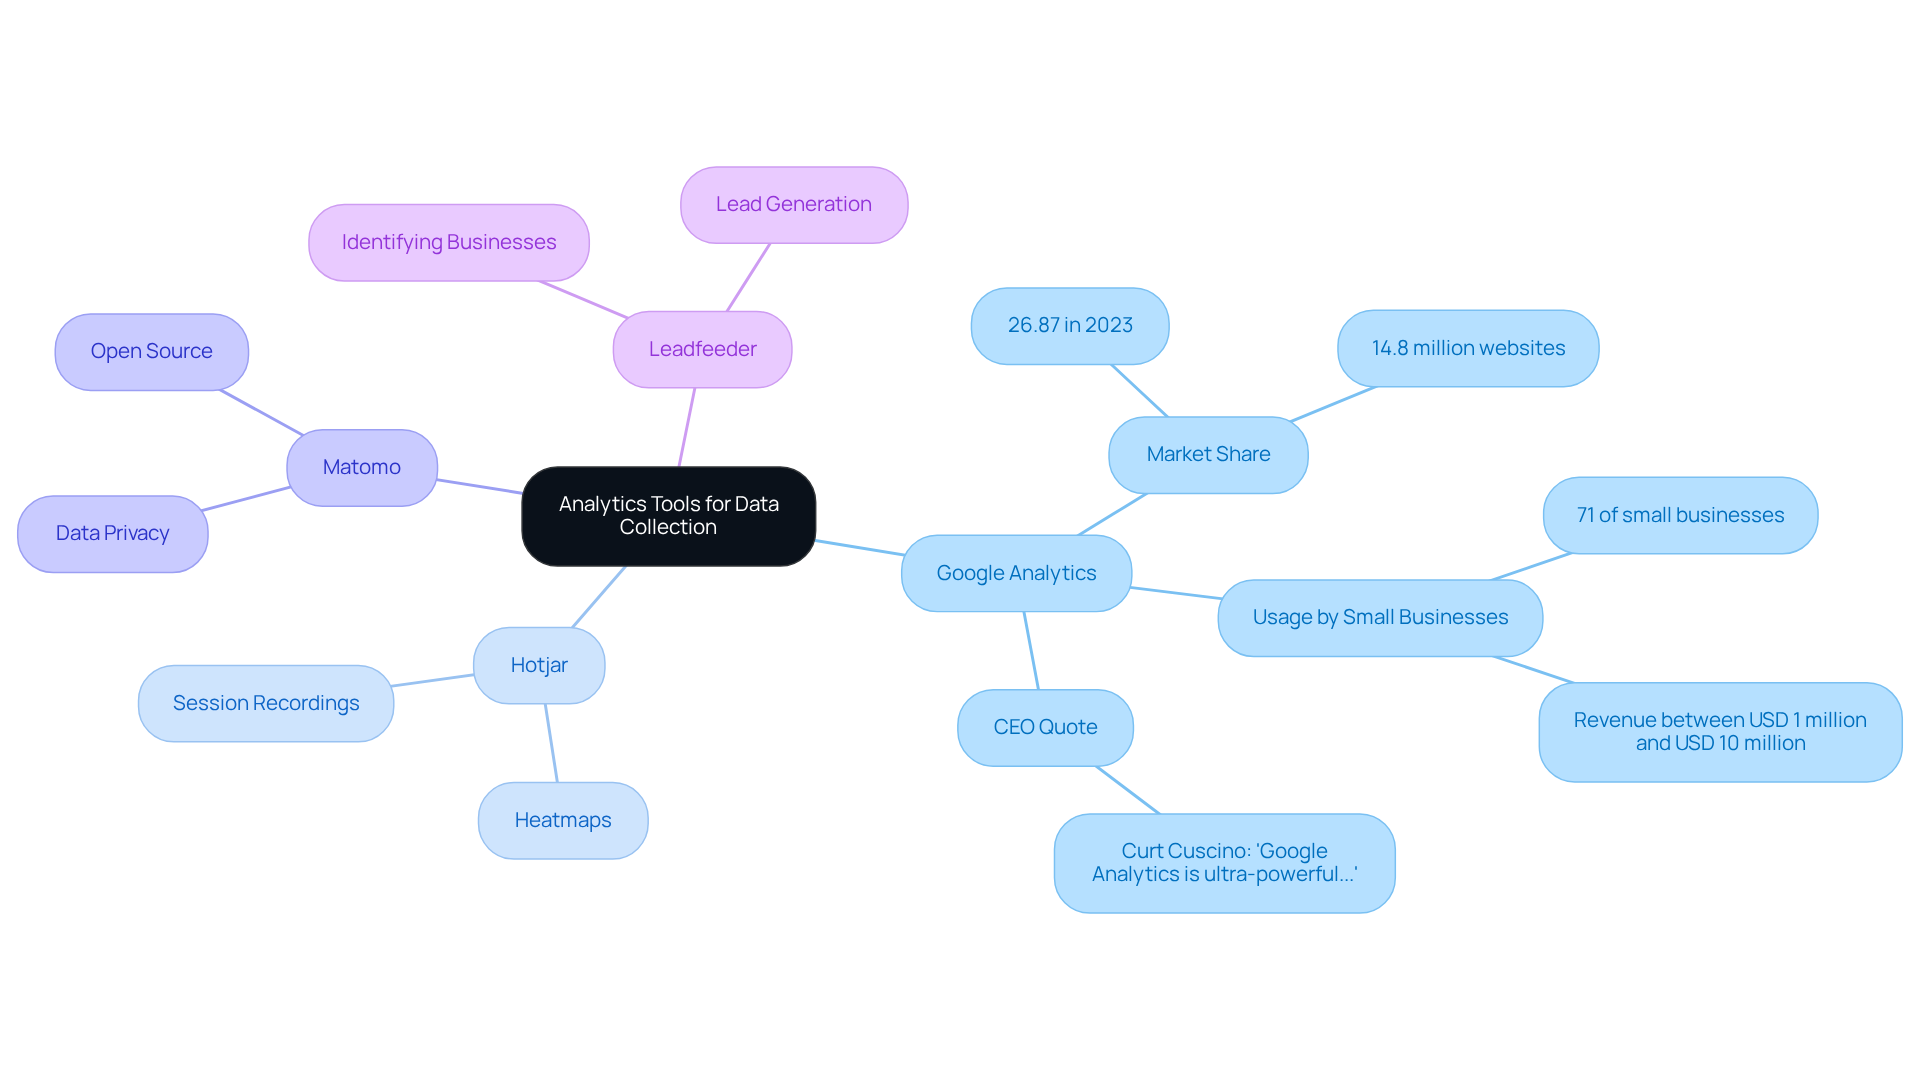
Google Analytics: This comprehensive platform is a staple for businesses, tracking user behavior and traffic sources. As of 2025, over 14.8 million websites rely on Google Analytics, representing about 83.5% of all sites. Notably, 71% of small businesses utilize its capabilities to make informed decisions, with many earning between USD 1 million and USD 10 million. In 2023, Google Analytics held a significant market share of 26.87%, underscoring its effectiveness in the digital marketing landscape. Curt Cuscino, Founder & CEO of HypeLife Brands, describes Google Analytics as "ultra-powerful for managing clients' MarTech stacks."
-
Hotjar: Known for its heatmaps and session recordings, Hotjar visualizes user interactions, providing insights into behavior that can enhance user experience.
-
Matomo: An open-source alternative to Google Analytics, Matomo prioritizes data privacy while offering detailed insights, making it an excellent choice for businesses concerned about compliance.
-
Leadfeeder: This tool identifies businesses visiting your site, facilitating targeted marketing initiatives and improving lead generation methods.
To make the most of these tools, it’s vital to ensure proper setup by integrating tracking codes into your website’s code and configuring goals that align with your business objectives. Regularly reviewing the collected data through analysis of website traffic is essential for informing and refining your marketing strategies, allowing you to adapt to the ever-evolving digital landscape.
However, it’s important to recognize that 67% of analytics leaders cite organizational culture as the biggest barrier to becoming a data-oriented company. This highlights the challenges organizations face in fully leveraging these tools. By acknowledging these hurdles and seeking support, you can foster a more data-driven culture within your organization, paving the way for growth and success. Remember, you’re not alone in this journey; there’s a community of support ready to help you thrive.

Analyze Data to Drive Strategic Decisions
Once data is collected, the next step is the analysis of website traffic to drive strategic decisions that can feel overwhelming at times. Many founders find themselves grappling with the sheer volume of information, unsure of how to turn it into actionable insights. This challenge can leave you feeling lost, but there are key steps you can take to navigate the analysis of website traffic on this journey with confidence.
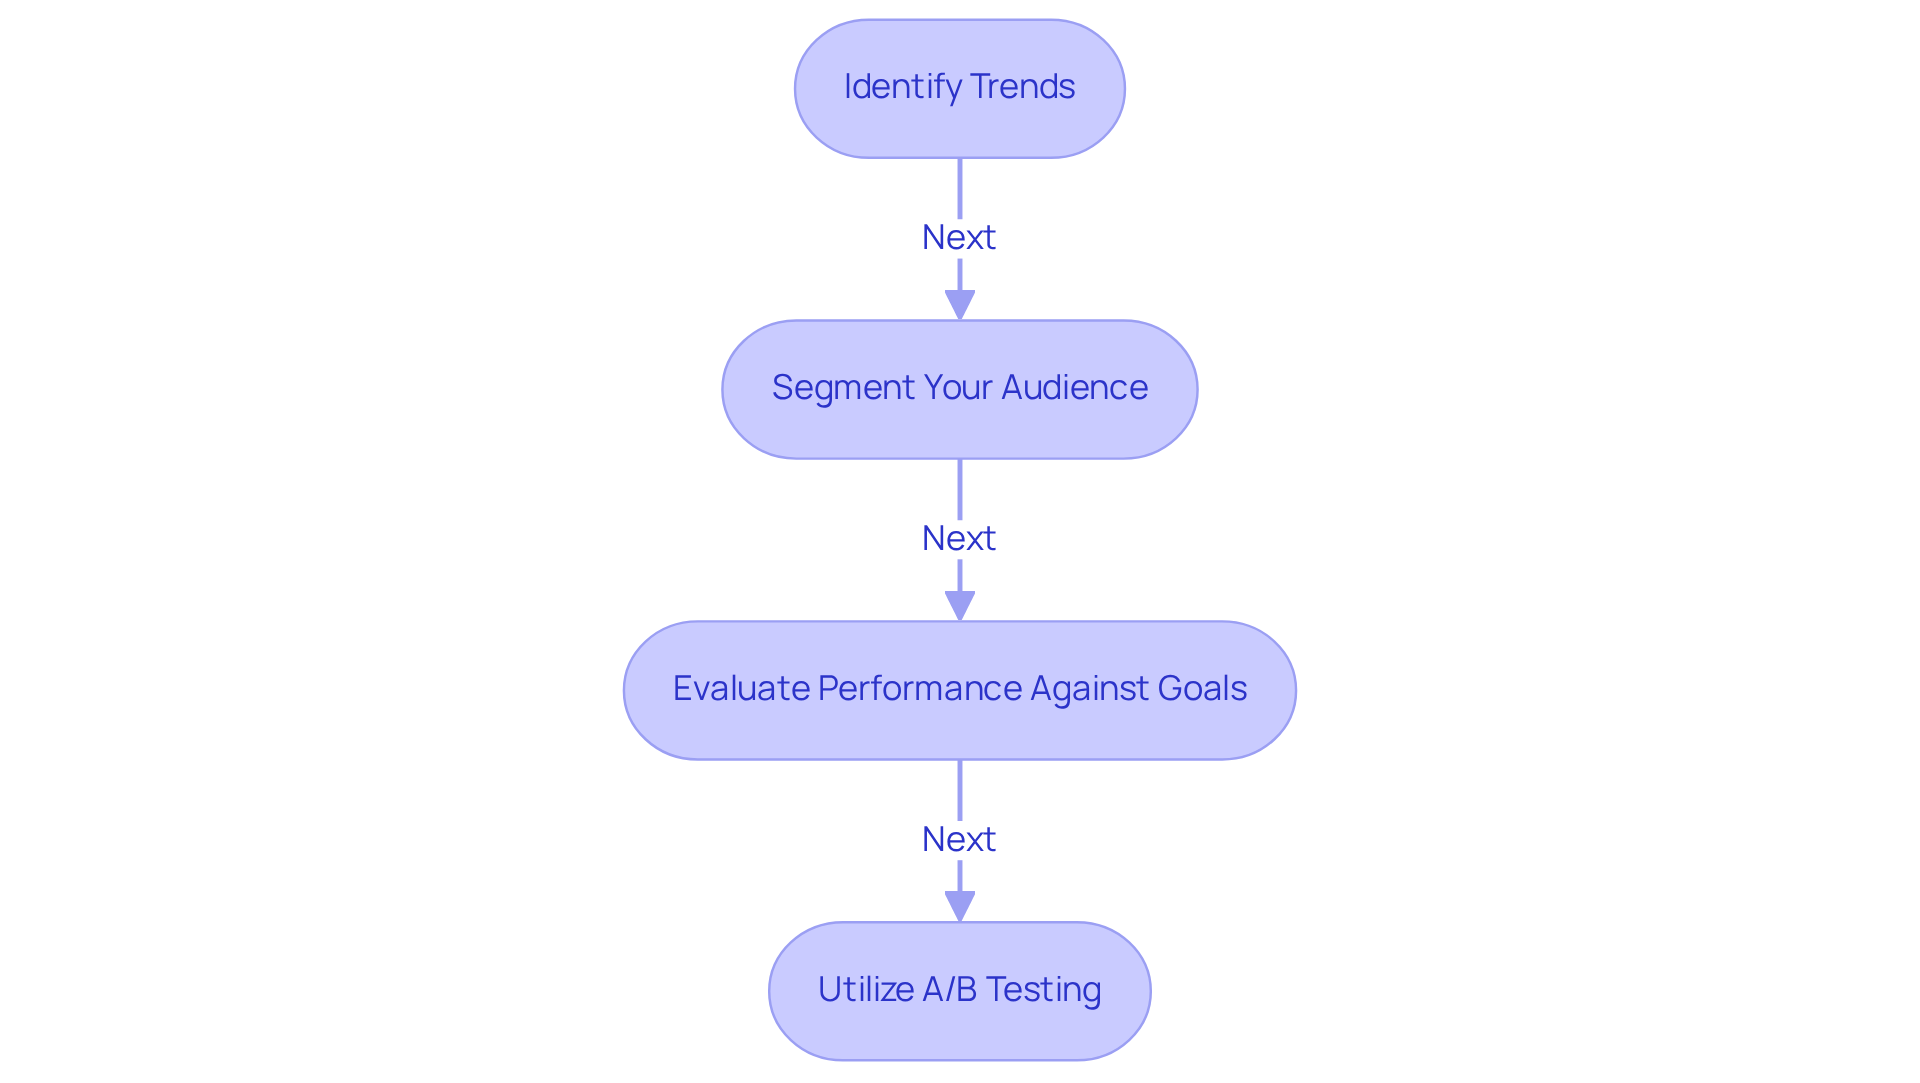
- Identify Trends: It’s essential to look for patterns in user behavior, such as peak traffic times or popular content. For instance, did you know that 37% of online platforms release new content several times daily? This trend towards regular updates can significantly enhance engagement. Moreover, releasing more than 16 blog posts each month can boost website visits by 3.5 times, highlighting just how crucial content frequency is in connecting with your audience.
- Segment Your Audience: Understanding your audience is vital. Break down data by demographics, behavior, or source of visitors to tailor your marketing efforts. Effective audience segmentation can dramatically improve your digital marketing outcomes. Personalized experiences have been shown to increase sales by 96%. With mobile devices generating over 60% of global traffic, knowing how different segments interact with your site on mobile versus desktop is essential for optimizing user experience.
- Evaluate Performance Against Goals: It’s important to conduct an analysis of website traffic to compare your metrics against predefined goals, assess your success, and identify areas needing improvement. Sales, leads, and conversion rates are the most critical metrics for evaluating online performance. Aim for a repeat visitor rate of 10% to 30% for sustained engagement. As Chris Thompson wisely points out, focusing on conversion rates is key to the analysis of website traffic and understanding the effectiveness of your strategies.
- Utilize A/B Testing: Experimenting with different website elements, like headlines and CTAs, can reveal what resonates best with your audience. A/B testing can uncover valuable insights into preferences, helping you refine your approaches and enhance user experience. Suzanne Bull emphasizes the need to improve pages with high new visitor counts to boost conversion rates.
By embracing these insights, you can enhance your strategies, optimize client experiences, and ultimately increase conversions. Remember, as Matthew Wood, a HubSpot Diamond Partner, emphasizes, understanding user behavior flow is crucial for keeping visitors engaged and guiding them to the right pages. You’re not alone in this journey; together, we can navigate the complexities of data analysis and create meaningful connections with your audience.

Monitor and Adjust Strategies Based on Insights
For tech startup founders, conducting an analysis of website traffic and adapting strategies based on insights can feel overwhelming, yet it is essential for continued success. Ignoring these metrics can lead to missed opportunities and stagnation. To navigate these challenges, consider implementing key practices that can make a significant difference:
-
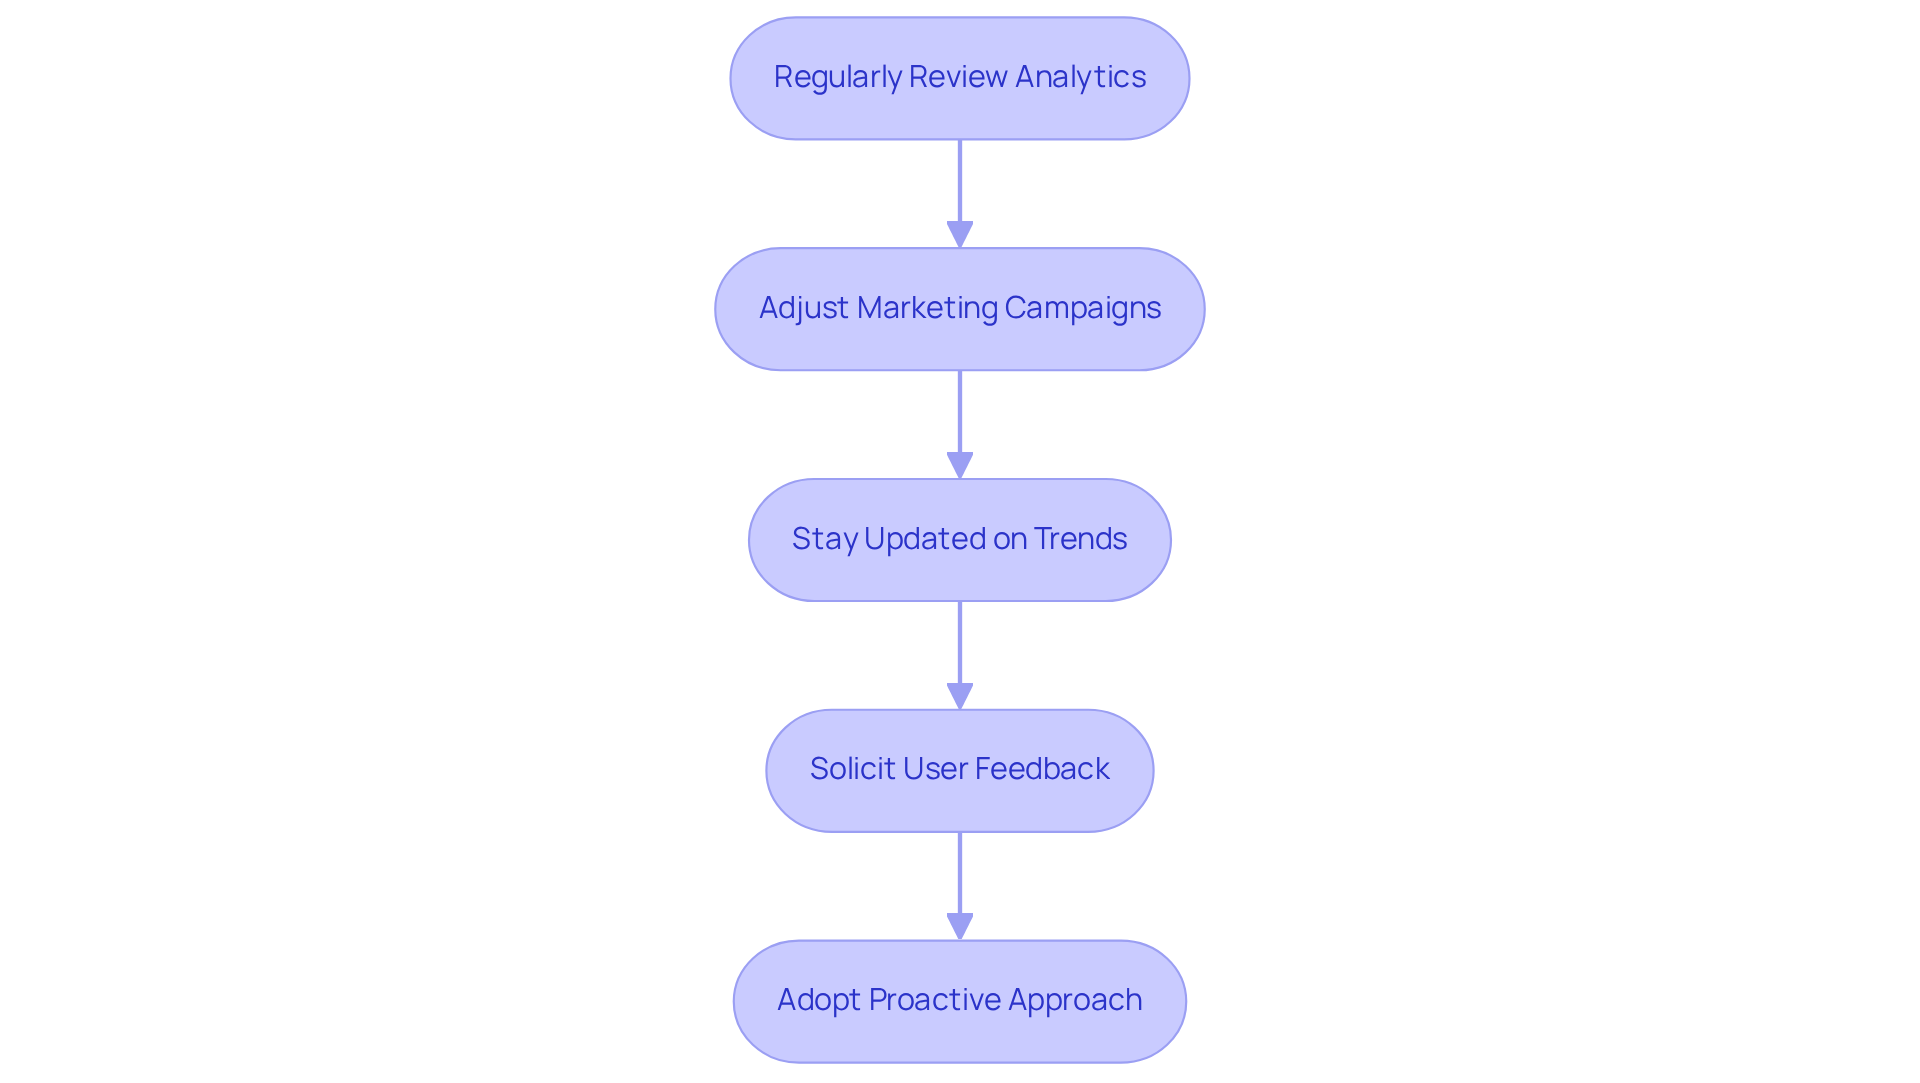
Regularly reviewing analytics is crucial. Set a schedule—perhaps weekly or monthly—to stay informed about your performance. This consistent check-in can aid in the analysis of website traffic, helping you understand what’s working and what isn’t.
-
Adjusting marketing campaigns based on these insights is equally important. Use the data to refine your efforts, targeting specific audience segments or optimizing your ad spend. This ensures your resources are being used effectively, directly impacting your growth.
-
Staying updated on trends is another vital step. By monitoring industry trends and competitor performance, you can adjust your approaches accordingly, ensuring you remain relevant in a fast-paced environment.
-
Finally, don’t underestimate the power of soliciting user feedback. Engage with your users through surveys or feedback forms to gain qualitative insights that complement your quantitative data. This connection not only provides valuable information but also fosters a sense of community.
By adopting a proactive approach to monitoring and adjusting your strategies, you can ensure that your business remains competitive and responsive to your audience's needs. Remember, you are not alone in this journey; many founders share these experiences, and together, we can navigate the challenges ahead.

Conclusion
Understanding and analyzing website traffic can feel overwhelming for tech startups striving to succeed in today’s digital landscape. Many founders grapple with defining key metrics, implementing effective analytics tools, and making sense of data. This challenge can lead to frustration, as the insights gained are crucial for enhancing user engagement and driving conversions. However, by embracing a proactive approach to these practices, businesses can transform this daunting task into an empowering journey.
Essential metrics such as:
- Page views
- Unique visitors
- Bounce rate
- Conversion rate
serve as the foundation for understanding website traffic. Tools like Google Analytics and Hotjar can simplify data collection and provide valuable insights. As you navigate this process, consider the importance of identifying trends, segmenting audiences, and utilizing A/B testing to refine your strategies. These steps ensure that your business remains responsive to user needs, fostering a deeper connection with your audience.
In conclusion, taking a proactive stance on website traffic analysis can unlock new avenues for growth and engagement. By nurturing a data-driven culture and continuously adapting your strategies based on insights, you can not only enhance your performance but also create meaningful connections with your audience. The journey may present its challenges, yet with the right tools and practices, success is well within reach. Remember, you are not alone in this endeavor—embracing these strategies can lead to a thriving community around your startup.
Frequently Asked Questions
What are the key metrics for website traffic analysis?
The key metrics include Page Views, Unique Visitors, Bounce Rate, Conversion Rate, Average Session Duration, Mobile Optimization, and Loading Speed.
What does the Page Views metric indicate?
Page Views represent the total number of pages viewed on your site, serving as an indicator of overall engagement and interest in your content.
How do Unique Visitors differ from Page Views?
Unique Visitors count distinct individuals visiting your site, providing insight into your reach and audience size, while Page Views reflect the total number of pages viewed regardless of the number of visitors.
What does Bounce Rate signify?
Bounce Rate indicates the percentage of visitors who exit after viewing just one page, suggesting potential issues with content relevance or user experience.
What is a typical range for Bounce Rate?
The average Bounce Rate typically ranges from 41% to 55%.
Why is Conversion Rate important?
Conversion Rate measures the percentage of visitors who complete desired actions, such as signing up for a newsletter or making a purchase, and improving this rate can be more effective than simply increasing traffic.
What does Average Session Duration measure?
Average Session Duration indicates the average time visitors spend on your site, reflecting their engagement levels.
How long do users typically spend on a single page?
Users typically spend about 54 seconds on a single page.
Why is Mobile Optimization critical?
Mobile Optimization is crucial because 67% of individuals are more inclined to make a purchase on a mobile-friendly platform, improving user experience and driving conversions.
What is the significance of Loading Speed?
Loading Speed is vital because almost half of visitors will not wait longer than two seconds for a page to load, impacting retention and engagement.


