

Introduction
Have you ever felt overwhelmed trying to understand how users truly interact with your digital product? Understanding user interactions is essential for any business that wants to connect with its audience in a meaningful way. Analytics for UX not only reveals how users engage with a platform but also uncovers valuable insights that can drive design improvements and enhance user satisfaction.
Many companies realize how vital these insights are, yet they often struggle with the question: how can you create strategies that not only enhance engagement but also build lasting connections with your users?
In this article, we’ll explore some heartfelt methods and best practices for mastering UX analytics, so you can truly connect with your users and create experiences that resonate deeply.
Define UX Analytics and Its Importance for User Engagement
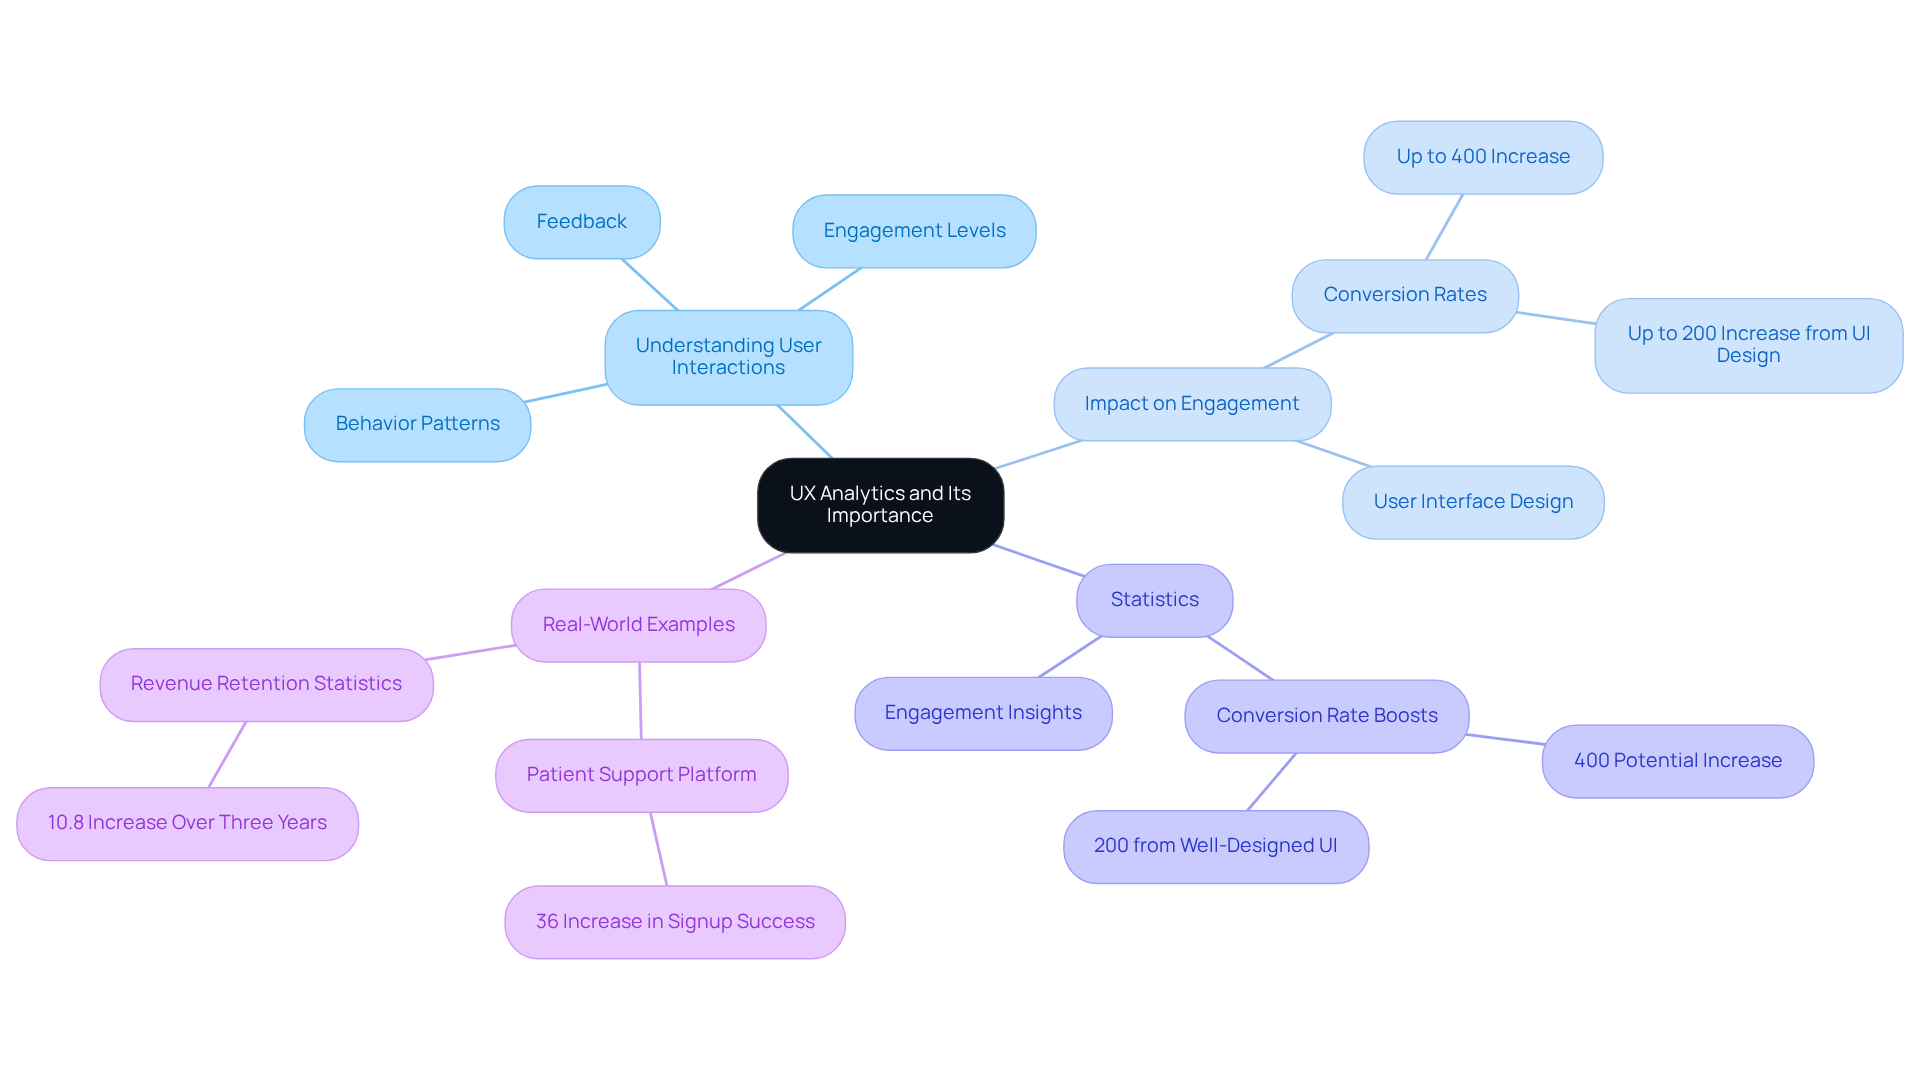
Have you ever felt lost trying to understand how your audience interacts with your digital products? The process of analytics for UX is all about gathering and examining information on these interactions. It involves looking at behavior patterns, engagement levels, and feedback to see how well your product meets your audience's needs. The beauty of UX insights, driven by analytics for UX, lies in their ability to provide actionable information that can guide your design choices, enhance interactions, and ultimately boost engagement. When startups invest in analytics for UX, they can identify pain points and preferences, allowing them to create deeper connections with their audience.
Did you know that companies that prioritize user experience can see their conversion rates soar by up to 400%? A well-designed user interface can also boost conversion rates by as much as 200%. Looking ahead, the demand for analytics for UX is set to rise significantly, with 70% of companies planning to hire UX professionals to enhance their digital strategies by 2026.
Let’s look at some real-world examples.
- A redesigned patient support platform saw a remarkable 36% increase in signup success rates, showcasing how analytics for UX can lead to substantial engagement gains.
- Similarly, organizations that continuously test their user interfaces and apply analytics for UX report enhanced revenue retention by up to 10.8% over three years, highlighting the long-term benefits of investing in engagement.
At RNO1, we understand that every startup has unique needs, and our flexible agency model is designed to support your journey toward growth and innovation. By fostering partnership and collaboration, we help you craft experiences that truly resonate with your audience, paving the way for success in a competitive landscape. When you prioritize analytics for UX, you’re not just improving your product; you’re also building lasting relationships with your audience that can drive your success.
Identify Key Metrics for Measuring User Engagement in UX Analytics
Are you struggling to keep users engaged on your platform? To effectively measure user engagement through analytics for UX, it’s important to focus on several key metrics that can truly make a difference.
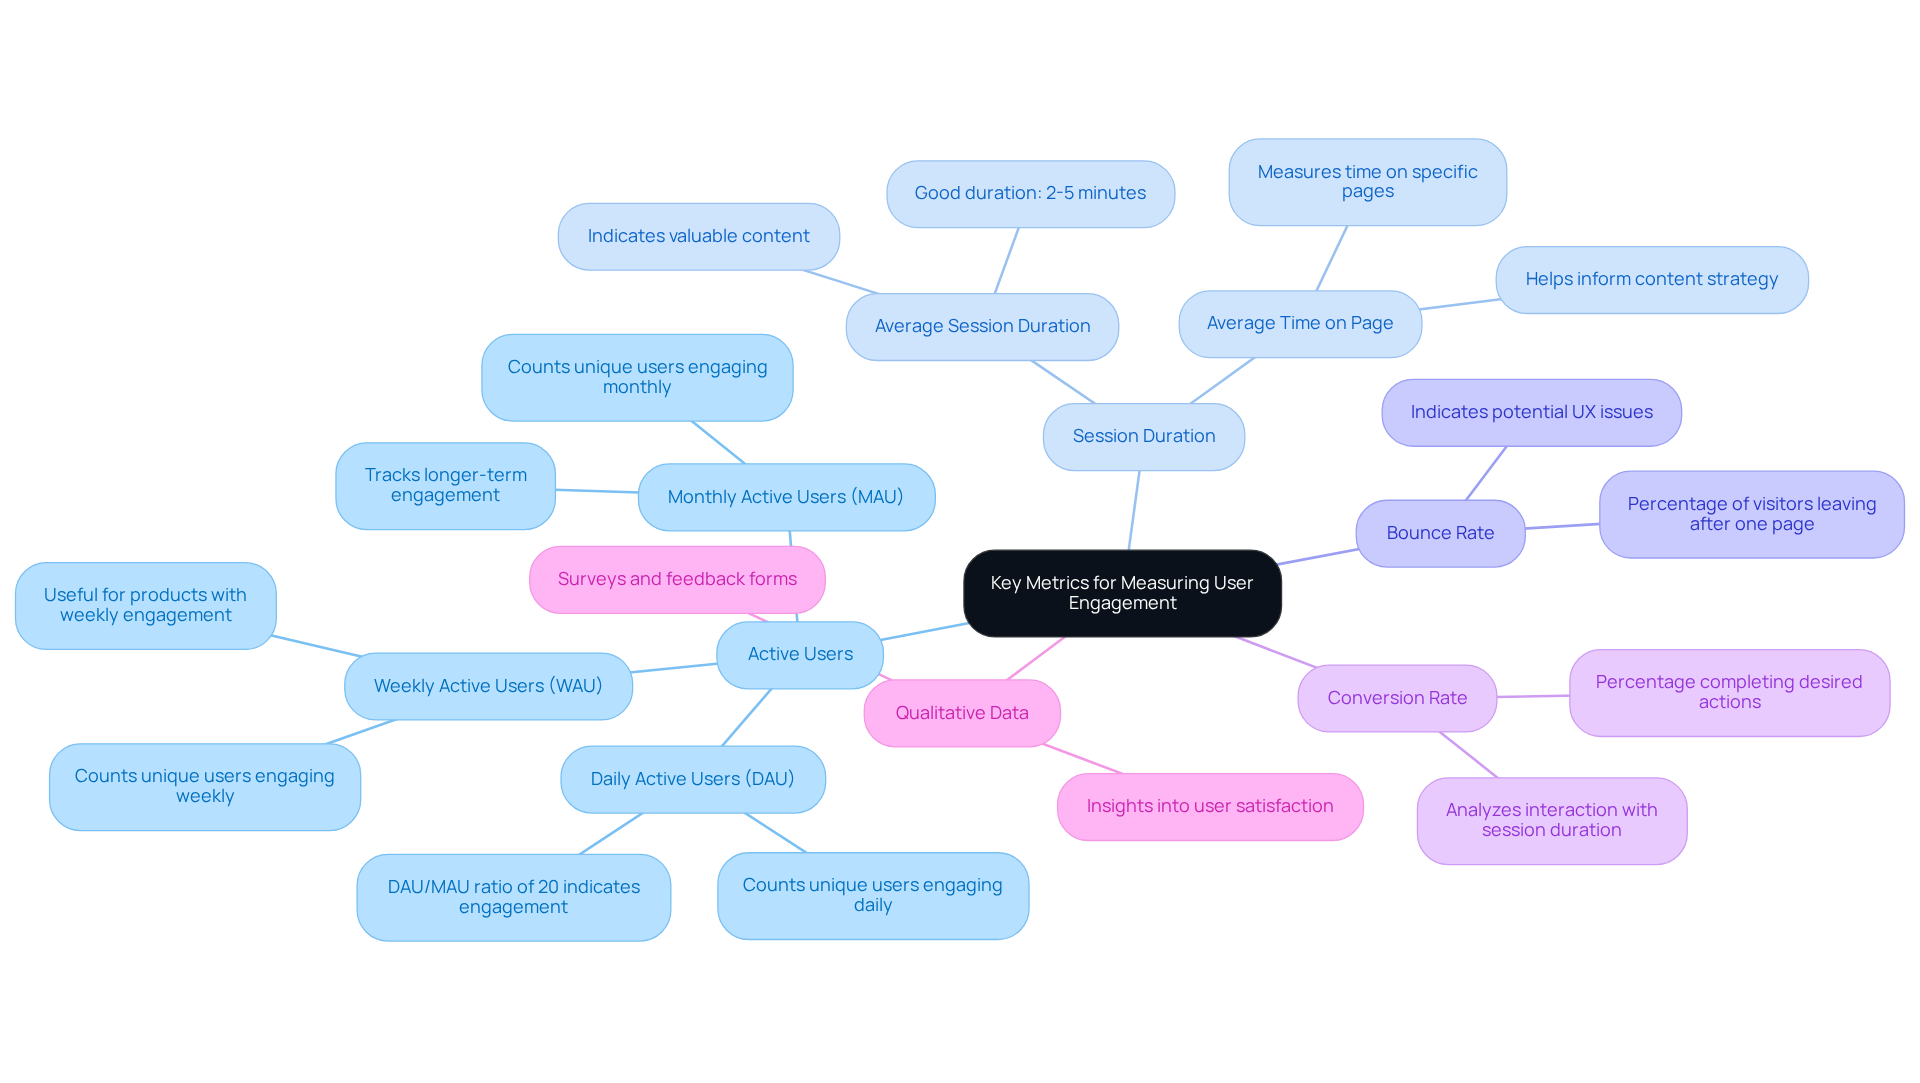
- Active Users: Tracking Daily Active Users (DAU), Weekly Active Users (WAU), and Monthly Active Users (MAU) is essential for gauging overall engagement levels. When you see a DAU/MAU ratio of 20%, it indicates that individuals are actively engaging with your platform. A ratio exceeding 50% is remarkable, often seen in messaging applications, and can be a goal to strive for.
- Session Duration: When users spend two to five minutes on your platform, it’s a sign they’re finding something valuable in your content. This average session duration suggests that visitors are engaged and interested. As experts often say, "A good Average Session Duration typically ranges from two to five minutes."
- Bounce Rate: If you notice a high bounce rate, it can feel frustrating, as it often means users aren’t connecting with your content or may be facing challenges navigating your site. Analyzing the percentage of visitors who leave after viewing only one page helps identify potential issues in the user experience.
- Conversion Rate: Monitoring the percentage of individuals completing desired actions, such as signing up or making a purchase, evaluates the effectiveness of your UX design. Understanding the interaction between conversion rates and Average Session Duration can assist in enhancing engagement.
- Collecting qualitative data through surveys and feedback forms provides insights into satisfaction and areas for enhancement. Involving individuals in this manner cultivates a cooperative atmosphere where their needs and preferences influence the digital journey.
A compelling illustration of the effectiveness of concentrating on participant interaction metrics is Duolingo's focus on Current User Retention Rate (CURR), which resulted in an impressive 350% growth acceleration in DAU. By concentrating on these metrics, you can cultivate a thorough understanding of engagement and leverage analytics for UX to make data-driven choices to enhance your digital experiences. Imagine transforming your user experience into one that not only retains users but also fosters a thriving community around your brand.
Implement Effective Tools and Methods for UX Analytics
Many businesses find it challenging to grasp how users truly engage with their platforms, leading to missed opportunities for improvement. To harness the power of UX analytics, consider implementing the following tools and methods:
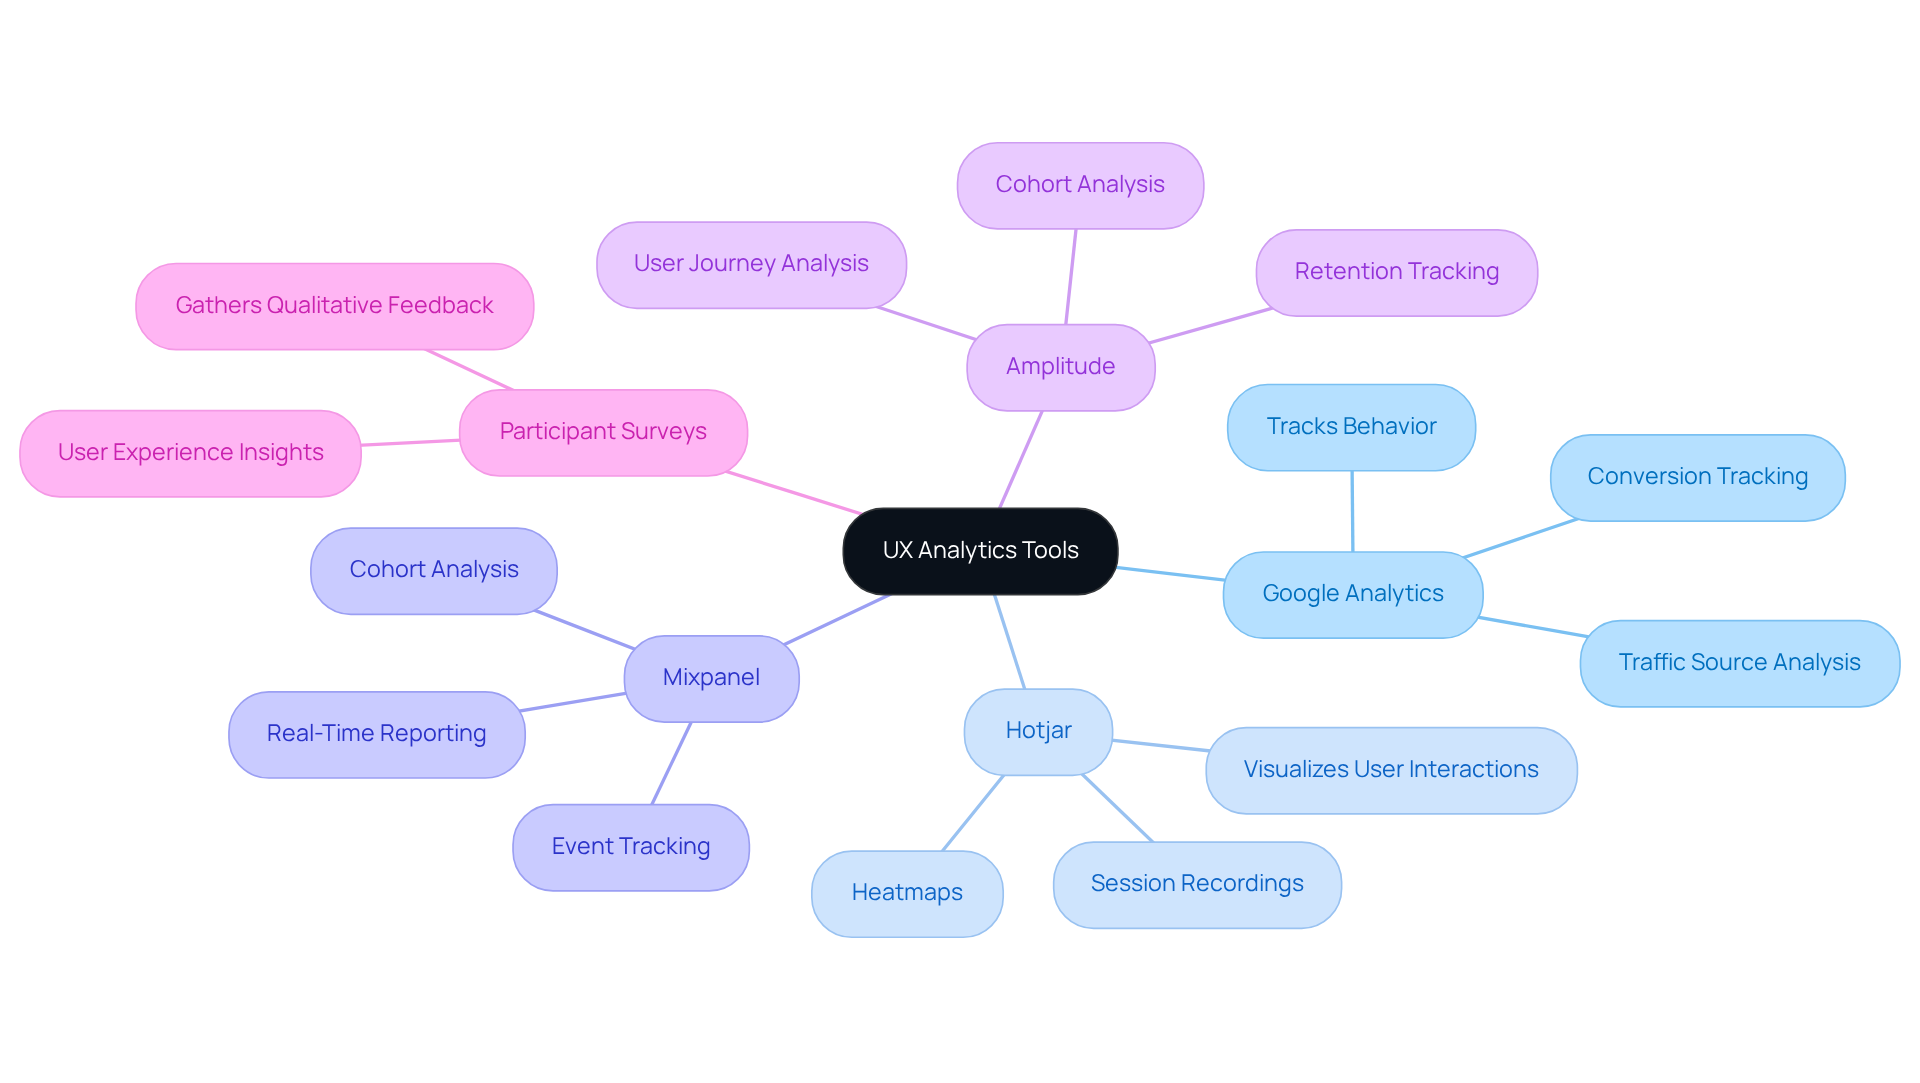
- Google Analytics: Understanding how your users engage with your digital assets is essential for creating meaningful experiences. This robust platform tracks behavior, traffic sources, and conversion rates, providing a comprehensive overview of interactions. Data shows that pages loading in one second achieve conversion rates up to 2.5 times greater than those loading in five seconds, underscoring the importance of performance in overall experience.
- Hotjar: This tool offers heatmaps and session recordings, allowing you to visualize behavior and identify areas for enhancement. By leveraging analytics for ux to understand where users click and how they navigate, you can make informed design decisions. The insights gained from analytics for ux can lead to significant improvements in audience interaction and conversion rates.
- Mixpanel: Focused on event tracking, Mixpanel helps you analyze actions and engagement patterns over time. This insight is vital for optimizing user journeys and enhancing retention through analytics for ux. As the demand for insights from users continues to grow, with 55% of respondents noting an increase over the past year, leveraging Mixpanel can help you stay ahead in understanding your audience.
- Amplitude: A powerful analytics platform, Amplitude offers insights into retention and engagement, assisting you in understanding user journeys. Its cohort analysis features enable you to monitor behavior over time, resulting in more effective product strategies. Forrester research suggests that every $1 invested in UX can return up to $100, highlighting the financial benefits of investing in tools like Amplitude.
- Participant Surveys: Implementing tools like SurveyMonkey or Typeform can help you gather qualitative feedback directly from participants, offering insights into their experiences and preferences. This direct feedback is invaluable for refining designs centered around users and ensuring that your products meet their needs.
With RNO1's support, you can turn insights into action, creating experiences that not only meet but exceed your users' expectations. By embracing these tools, you’ll transform your understanding of user behavior with analytics for ux, paving the way for enhanced experiences and stronger connections with your audience.
Explore Future Trends in UX Analytics for Enhanced Engagement
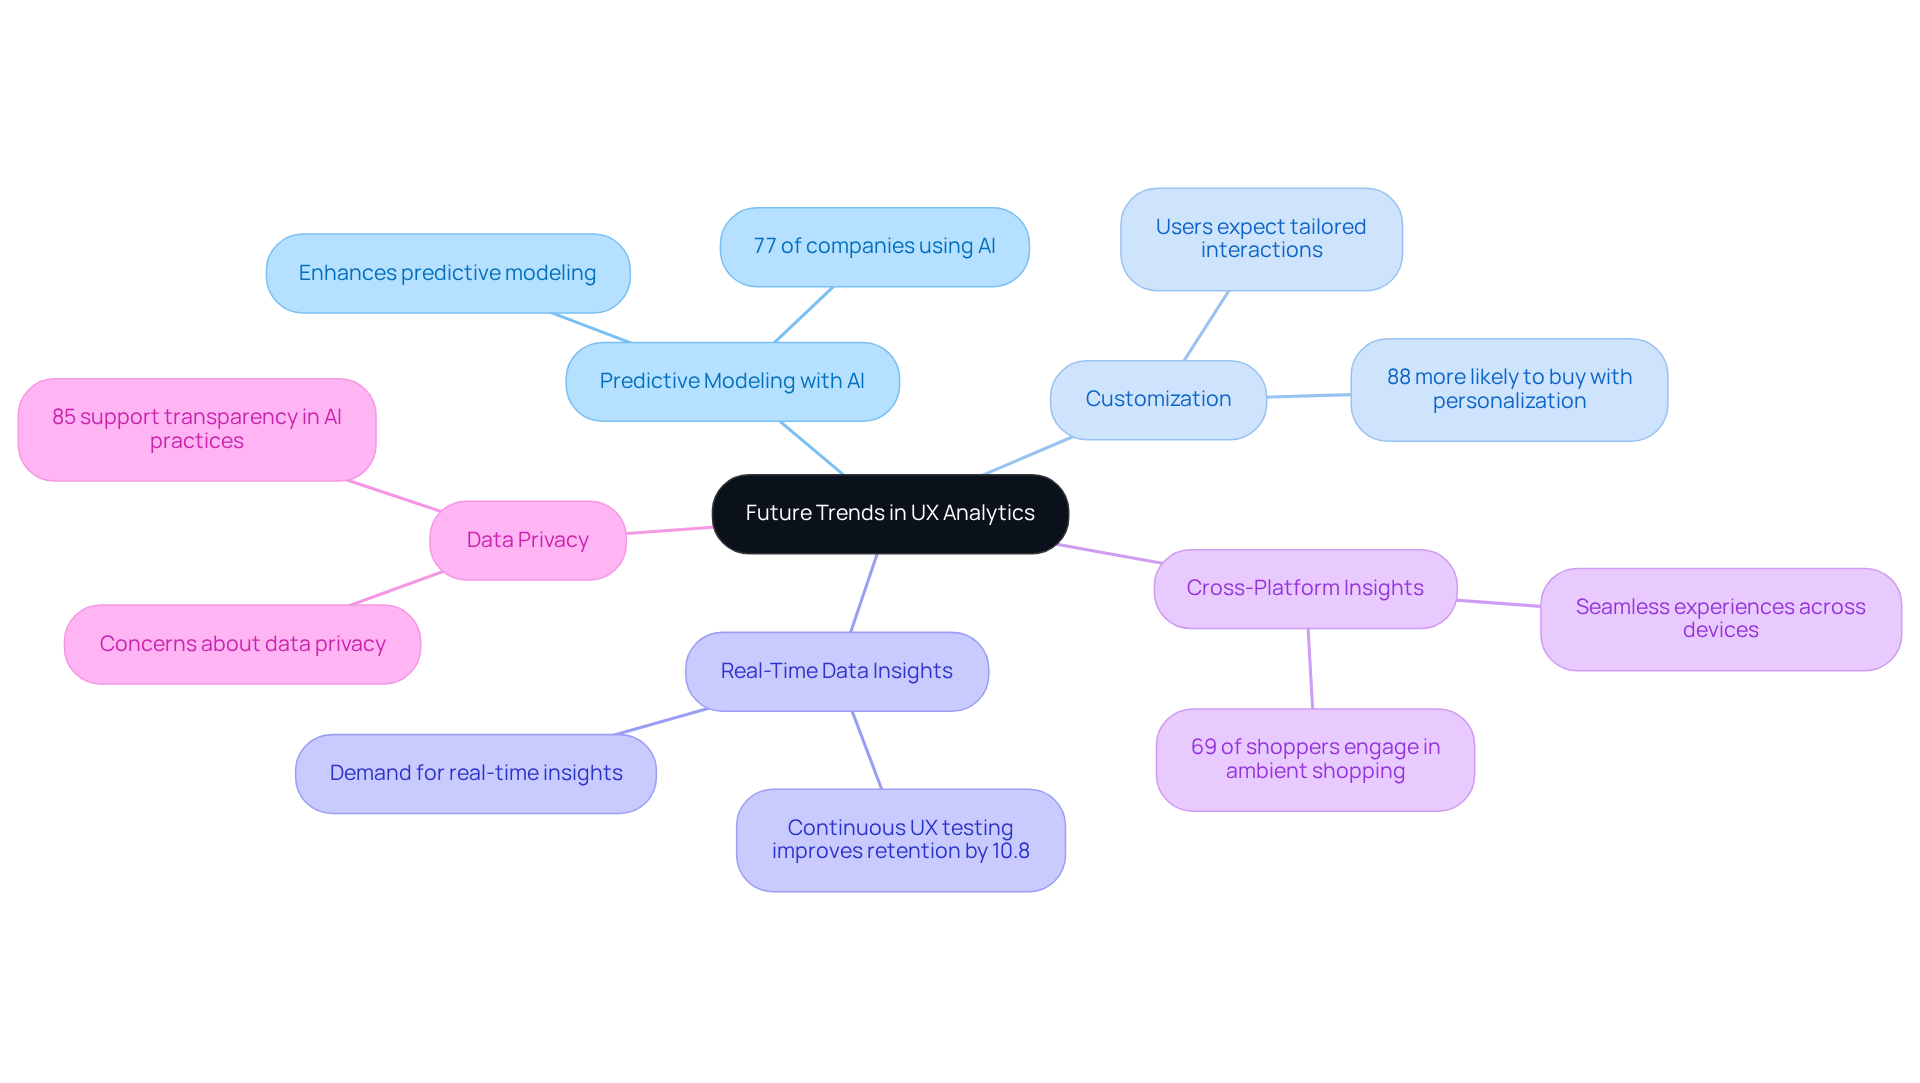
As tech startup founders, you might feel overwhelmed by the rapid changes in analytics for UX and the pressure to keep up with user expectations. Imagine being able to predict user behavior with the help of AI in analytics for UX - this is becoming a reality for many businesses today. The integration of AI enhances predictive modeling, allowing you to foresee behavior patterns and customize interactions accordingly. In fact, 77% of companies are either using or exploring AI technologies, with 83% prioritizing AI in their business strategies.
Think about how much more connected your users feel when their experiences are tailored just for them - this is the power of customization in analytics for UX. Users expect tailored interactions that meet their specific needs, and they are 88% more likely to buy when engagement is personalized in real time. This highlights the importance of customization in driving conversions.
Have you ever wished you could adjust your strategies on the fly? The growing demand for real-time data insights makes analytics for UX possible, enabling you to enhance customer interactions instantly. Organizations that implement continuous UX testing can see revenue retention improvements of up to 10.8% over three years, which emphasizes the importance of analytics for UX in providing timely data.
Cross-Platform Insights: Picture your users seamlessly interacting with your brand across different devices - this is the reality we need to create for them. As individuals engage with brands across various platforms, integrating insights across these channels offers a comprehensive perspective on behavior. With 69% of shoppers regularly participating in 'ambient shopping,' it’s clear that seamless experiences across devices are essential.
In a world where data privacy is a growing concern, how can we ensure our users feel safe while still benefiting from analytics? Businesses must prioritize clear data practices while utilizing analytics for UX in audience interaction. A significant 85% of respondents support transparency about AI assurance practices before products are marketed, emphasizing the need for ethical considerations in data usage.
By staying informed about these trends, you can adapt your UX strategies to meet evolving user expectations and enhance engagement. Embracing these trends not only enhances user engagement but also fosters a deeper connection with your audience, paving the way for lasting loyalty and growth.
Conclusion
Are you feeling overwhelmed by the complexities of user engagement in your digital space? Mastering analytics for UX is crucial for enhancing user engagement and creating meaningful experiences. Many businesses find it challenging to decipher user behavior, leading to missed opportunities for connection. By leveraging data-driven insights, you can better understand your users, identify their pain points, and tailor your offerings to meet their needs. This approach not only boosts engagement but also fosters lasting relationships between your brand and users, ultimately driving success in a competitive landscape.
Key strategies include:
- Identifying critical metrics like active users, session duration, and conversion rates, which provide a comprehensive view of user engagement.
- Implementing effective tools such as Google Analytics, Hotjar, and Mixpanel enables you to gather actionable insights that inform your design decisions.
- Embracing future trends like AI-driven analytics and cross-platform insights can significantly enhance user experiences, ensuring that interactions are personalized and seamless.
In today’s fast-paced digital world, understanding your users isn’t just important; it’s vital for your success. By partnering with a supportive agency like RNO1, you can unlock the potential of analytics, creating experiences that truly connect with your audience. Embrace these strategies and tools to transform your user engagement efforts, paving the way for innovation and growth in your digital journey. By embracing these strategies, you’re not just improving engagement; you’re building a community that truly values your brand.
Frequently Asked Questions
What is UX analytics?
UX analytics involves gathering and examining information on how users interact with digital products, focusing on behavior patterns, engagement levels, and feedback to assess how well a product meets audience needs.
Why is UX analytics important for user engagement?
UX analytics provides actionable insights that guide design choices, enhance user interactions, and ultimately boost engagement. It helps identify pain points and preferences, allowing startups to create deeper connections with their audience.
How can investing in UX analytics impact conversion rates?
Companies that prioritize user experience can see conversion rates increase by up to 400%. A well-designed user interface can also boost conversion rates by as much as 200%.
What is the future demand for UX professionals?
The demand for UX analytics is expected to rise significantly, with 70% of companies planning to hire UX professionals to enhance their digital strategies by 2026.
Can you provide examples of the impact of UX analytics?
Yes, a redesigned patient support platform experienced a 36% increase in signup success rates due to UX analytics. Additionally, organizations that continuously test their user interfaces and apply UX analytics report enhanced revenue retention by up to 10.8% over three years.
How does RNO1 support startups in utilizing UX analytics?
RNO1's flexible agency model is designed to support startups by fostering partnership and collaboration, helping them craft experiences that resonate with their audience and drive growth and innovation.
List of Sources
- Define UX Analytics and Its Importance for User Engagement
- Predictive Modeling & AI Decision Support for Healthcare | Intechnic (https://intechnic.com/blog/100-ux-statistics-every-user-experience-professional-needs-to-know)
- 50+ UX Statistics To Convince Stakeholders 2025 (https://uxcam.com/blog/ux-statistics)
- 150+ UX (User Experience) Statistics and Trends (Updated for 2026) (https://userguiding.com/blog/ux-statistics-trends)
- 40+ Key UX Stats for 2026 (https://maze.co/blog/ux-statistics)
- 40+ UX Statistics: ROI, Design Impact & Career Data (2026) - Colorlib (https://colorlib.com/wp/ux-statistics)
- Identify Key Metrics for Measuring User Engagement in UX Analytics
- Active Users: DAU, WAU, and MAU Explained (https://statsig.com/perspectives/active-users-dau-wau-and-mau-explained)
- DAU, WAU, MAU and the DAU/MAU Ratio: Definitions and Formulas (https://mitzu.io/post/guide-to-dau-wau-and-mau)
- Average Session Duration - KPI Definition, Formula & Tips - AgencyAnalytics (https://agencyanalytics.com/kpi-definitions/average-session-duration)
- Understanding DAU, WAU & MAU metrics | Adjust Help Center (https://help.adjust.com/en/article/understanding-dau-wau-and-mau-metrics)
- Average Session Duration: Definition, Benchmarks & Tips (https://klipfolio.com/kpis/digital-marketing/average-session-duration)
- Implement Effective Tools and Methods for UX Analytics
- 40+ Key UX Stats for 2026 (https://maze.co/blog/ux-statistics)
- 6 Best UX Analytics Tools for User Research (https://contentsquare.com/guides/ux-analytics/tools)
- 13 Most Important Google Analytics Metrics To Track (2026) (https://analytify.io/most-important-google-analytics-metrics)
- Top 8 Best UX Analytics Tools To Understand User Behavior In 2026 (https://uxarmy.com/blog/top-ux-analytics-tools)
- Top 10 web analytics tools for 2026. (https://quantummetric.com/blog/top-10-web-analytics-tools-for-2026)
- Explore Future Trends in UX Analytics for Enhanced Engagement
- Best 50+ UX statistics for 2026 (https://blog.uxtweak.com/ux-statistics)
- 40+ Key UX Stats for 2026 (https://maze.co/blog/ux-statistics)
- 40+ UX Statistics (from 200,000 hours of UX Research) – Baymard (https://baymard.com/learn/ux-statistics)
- 30+ Essential UX Research Statistics for 2026 Strategy (https://koji.so/blog/ux-research-statistics-2026)
- 137 AI Statistics and Trends for 2026 | National University (https://nu.edu/blog/ai-statistics-trends)


