Overview
Tech startups often face the challenge of demonstrating growth in a dynamic environment. This can lead to feelings of uncertainty and frustration, especially when it comes to understanding how to effectively measure success.
By focusing on essential metrics such as:
- Brand awareness
- Customer engagement
- Performance indicators like Net Promoter Score (NPS)
- Customer Lifetime Value (CLV)
founders can find clarity amidst the chaos. These metrics serve not only to refine branding strategies but also to improve customer satisfaction, ultimately enhancing overall business performance.
Embracing these insights is crucial for long-term success in a competitive landscape, and it’s a step toward fostering a thriving community around your startup.
Introduction
In the challenging world of tech startups, it can often feel overwhelming to keep track of the essential metrics that drive growth and establish a strong brand presence. Many founders find themselves grappling with the intricacies of digital marketing, research impact, and user engagement.
It’s crucial to focus on metrics that truly reflect brand awareness, customer perception, and engagement levels. Tracking indicators like Net Promoter Scores and click-through rates can feel daunting, but understanding these metrics is vital—they can significantly shape your startup's future.
This article aims to explore the key metrics that are indispensable for tech startups, offering insights into how you can refine your strategies. Together, we can foster sustainable growth and enhance your market positioning in this ever-evolving digital landscape.
RNO1: Branding Effectiveness Metrics for Tech Startups
Tech companies often face the challenge of prioritizing metric data such as brand awareness, customer perception, and engagement levels to drive growth effectively. This can be daunting, especially for startups trying to carve out their place in a competitive landscape. Key performance indicators (KPIs) like Net Promoter Score (NPS) and Customer Lifetime Value (CLV) are essential for assessing how well a brand resonates with its audience. As of 2025, the average NPS for tech startups stands at approximately 30, indicating a growing emphasis on customer satisfaction and loyalty.
To achieve brand awareness, startups need to deliver at least 6 to 7 impressions to their target audience. This highlights the importance of consistent engagement approaches. Moreover, 82% of prospective candidates consider a brand's reputation before applying for a position, underscoring the essential role of brand perception in attracting talent. RNO1's method emphasizes the ongoing observation and adjustment of branding strategies to align with market trends and consumer expectations. Successful tech companies leverage NPS and CLV to refine their branding efforts, ensuring they meet the evolving needs of their customers. For instance, RNO1's Ryde initiative demonstrates how to execute national campaigns and user-generated content programs effectively, enhancing e-commerce engagement through influencer partnerships. A recent case study on consumer trust revealed that 44% of Gen Z consumers are more comfortable sharing personal information when they trust a brand's security practices, highlighting the significance of establishing trust in the digital era.
Expert insights reveal that not only boost customer loyalty but also promote sustainable growth. By concentrating on brand recognition and customer perception metrics, technology companies can position themselves for long-term success in a competitive environment. To further enhance your branding efforts, consider implementing regular feedback loops with your audience to adapt and refine your strategies continuously. This nurturing approach fosters a sense of community and support, allowing your brand to grow alongside your customers.
Google Scholar Metrics: Tracking Research Impact and Engagement
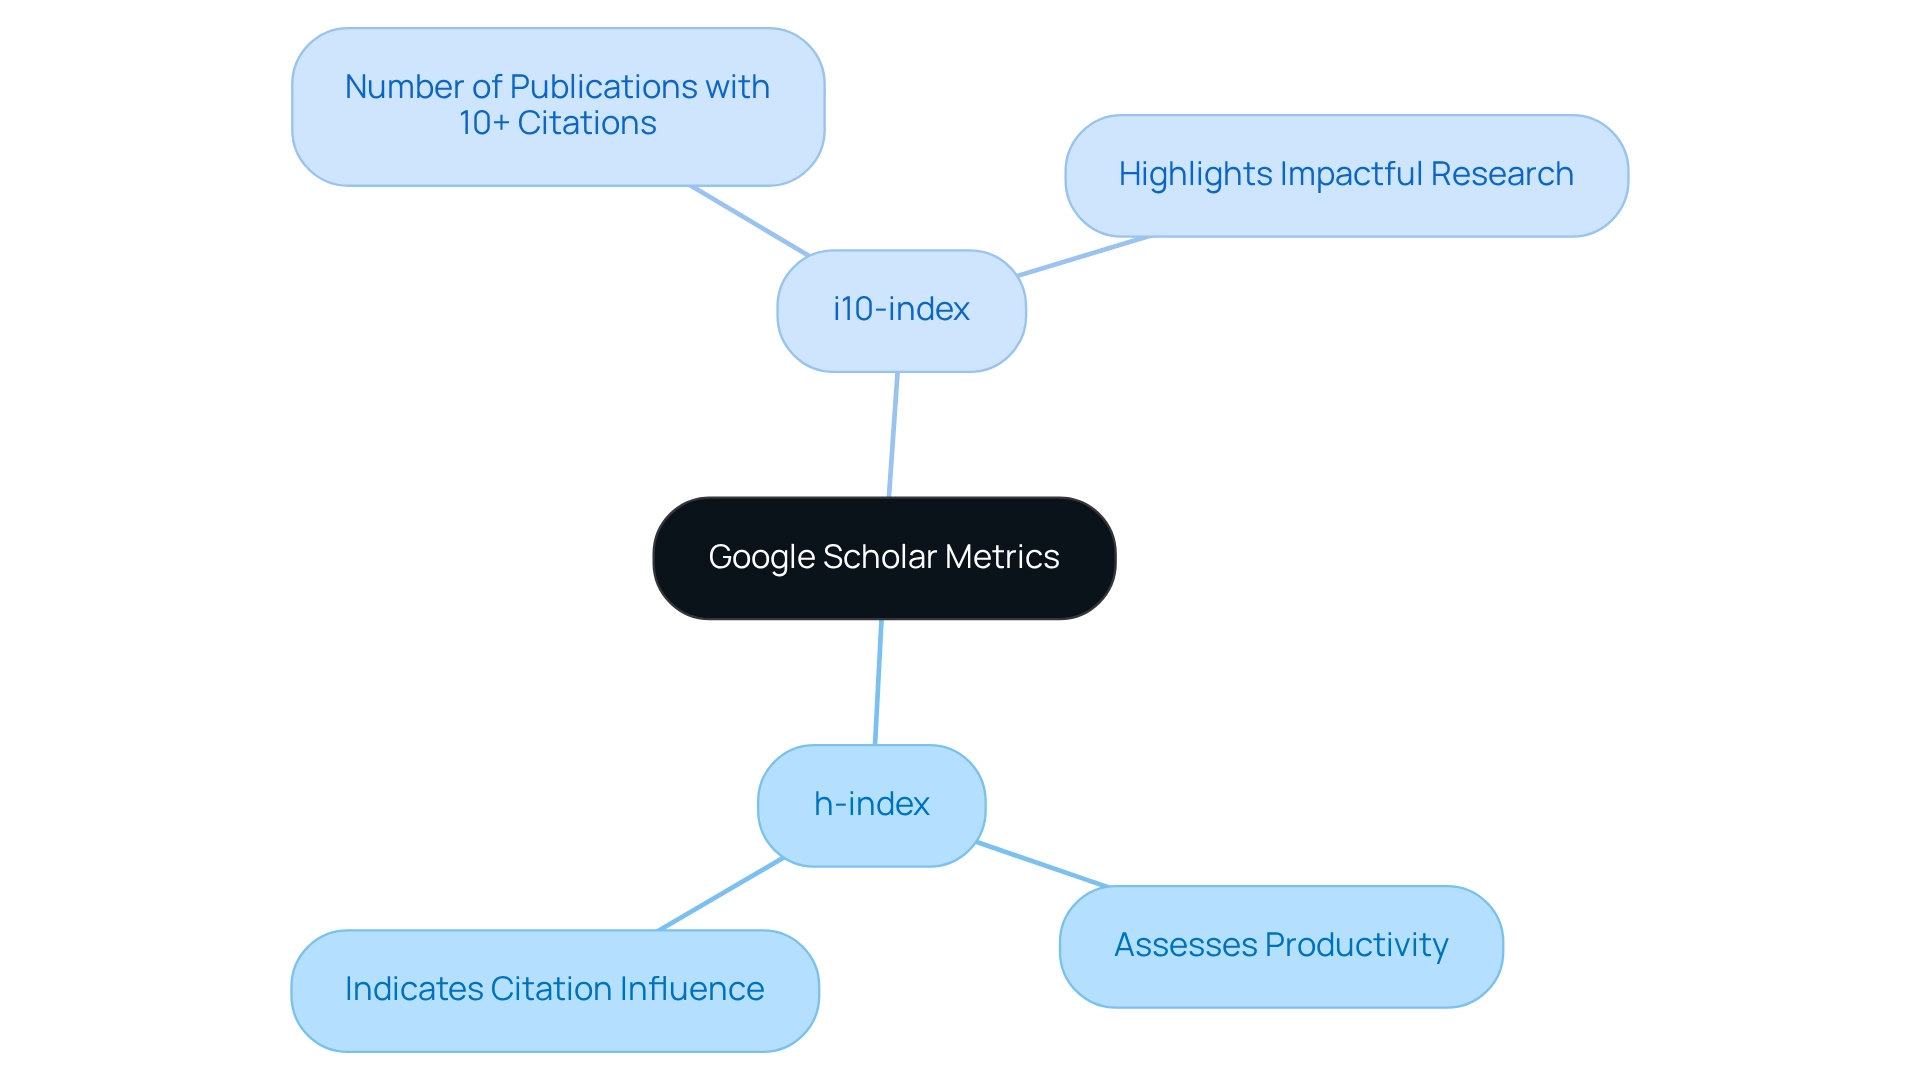
For many new businesses, monitoring citations and evaluating the influence of their research publications can feel overwhelming. Google Scholar Metrics serve as a vital resource in this journey, helping to illuminate the path forward. Metric tools like the h-index and i10-index offer valuable insights into the impact of a company's research output, addressing a common concern among tech startups. As we look ahead to 2025, it’s heartening to see that the average i10-index for technology ventures is around 10, showcasing a growing commitment to quality research contributions. Moreover, current h-index statistics reveal that many technology enterprises are achieving scores that reflect their increasing academic influence, with a commendable number reaching h-index values of 15 or higher.
This focus on research metrics not only enhances a new business's credibility but also attracts prospective investors and collaborators who value innovation rooted in research. The h-index serves as a powerful metric for assessing of a company's publications. In contrast, the i10-index serves as a metric that highlights the number of publications with at least ten citations, underscoring the organization's ability to generate impactful research.
As Roxanne beautifully expressed, "Utterly, utterly fascinating – thank you for running the numbers on this, and for doing it in such a thoughtful way." By effectively monitoring research influence through these metrics, emerging companies can proudly showcase their dedication to innovation and intellectual leadership. This, in turn, helps them establish themselves as trustworthy participants in their respective fields, fostering a sense of community and support among fellow founders navigating similar challenges.
Metrics for News: Analyzing Reader Engagement Scores
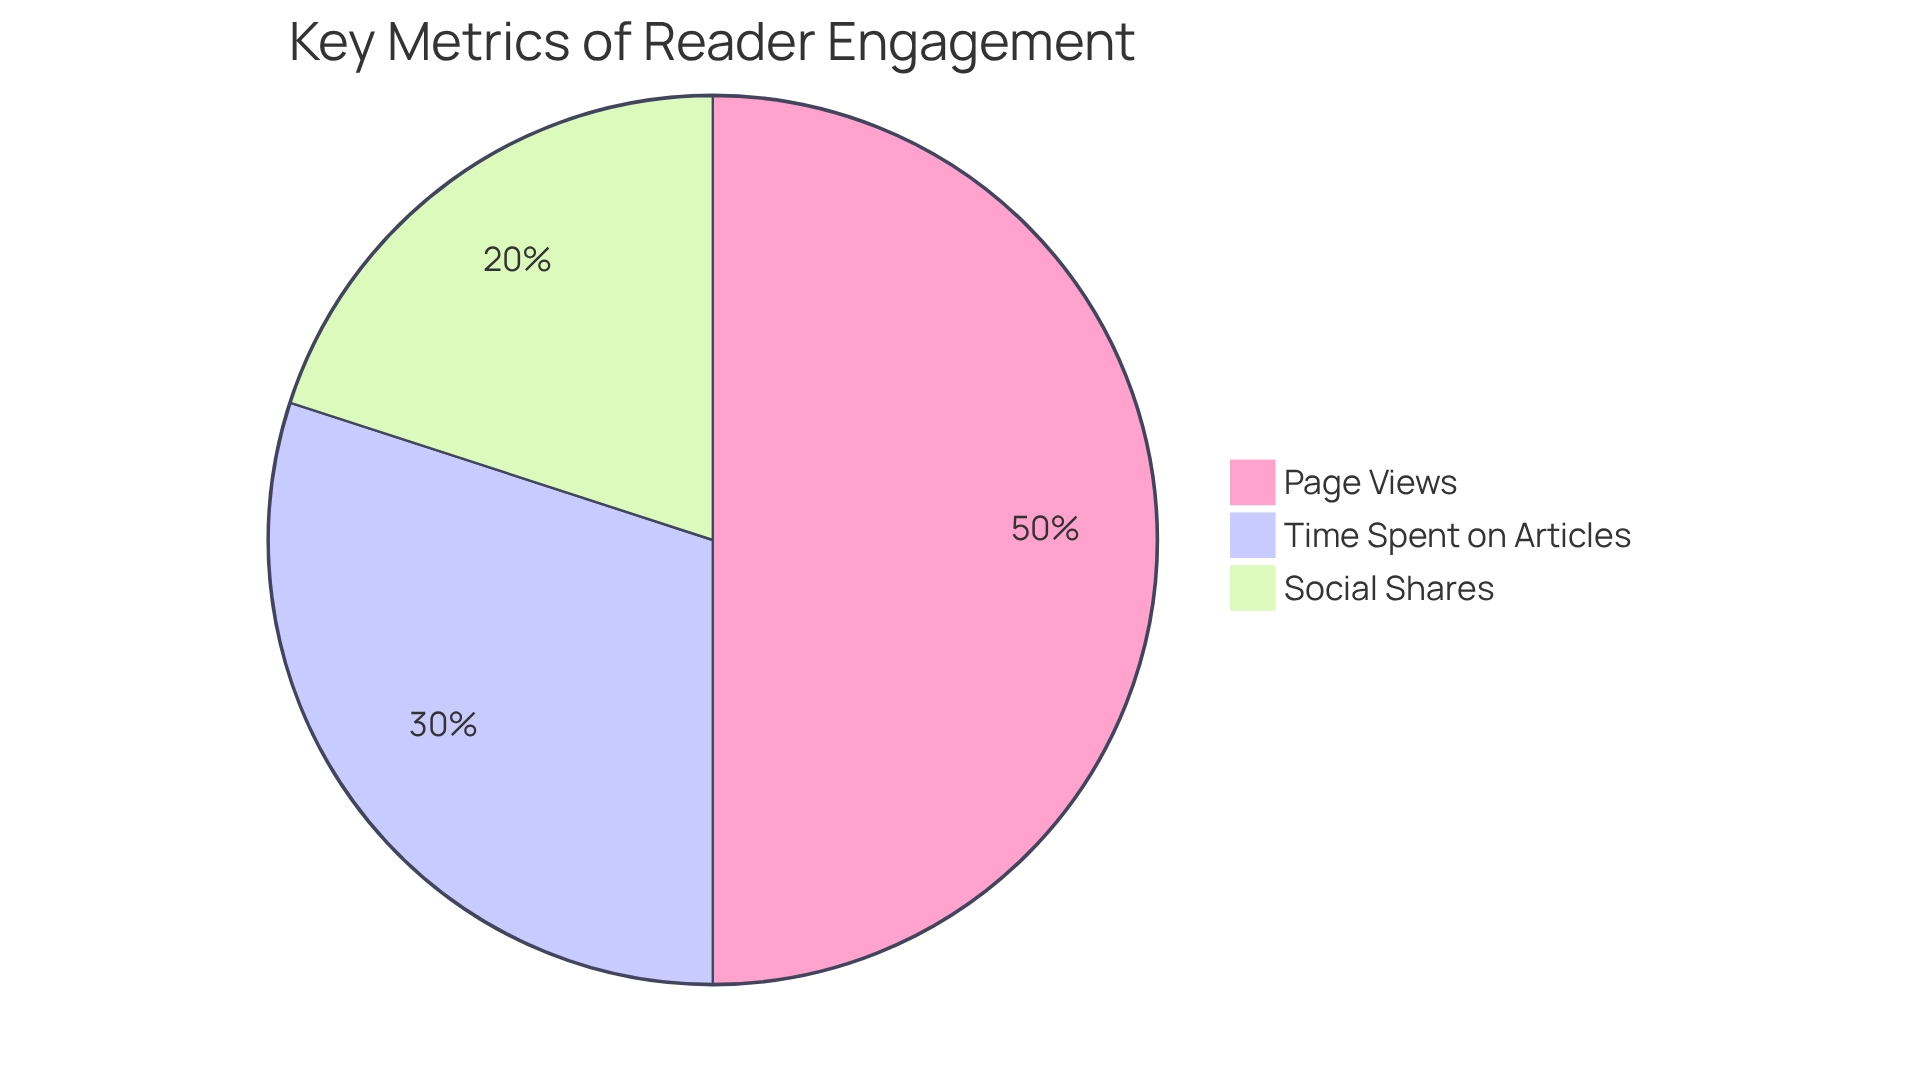
For new businesses, understanding reader involvement can feel overwhelming. It's essential to track data like page views, time spent on articles, and social shares. Tools such as Google Analytics can be incredibly helpful in examining these metrics, providing insights that not only improve content strategies but also enhance audience engagement. In 2025, tech company articles average around 1,200 page views, with audiences dedicating per article. High engagement scores foster brand loyalty and significantly boost conversion rates. With WordPress hosting 43% of the internet's websites, optimizing content for dominant platforms becomes crucial.
A case study on factors influencing website traffic reveals that optimizing load speed and interface design is vital for enhancing engagement and conversion rates. By implementing these improvements, new businesses can directly increase their reader engagement. Additionally, A/B testing can unveil user preferences, allowing businesses to tailor their content more effectively, while expert insights underscore the importance of understanding reader engagement metrics for new businesses striving for growth. As Murtuza Kutub noted, Shopify’s 86% growth in 2020 resulted in $2.9B in revenue, illustrating how effective content strategies can lead to significant financial success. By analyzing page views and time spent on articles, new businesses can pinpoint successful content strategies that resonate with their audience, ultimately paving the way for enhanced performance and sustainable growth.
Dynatrace: Service Performance Metrics for Digital Products
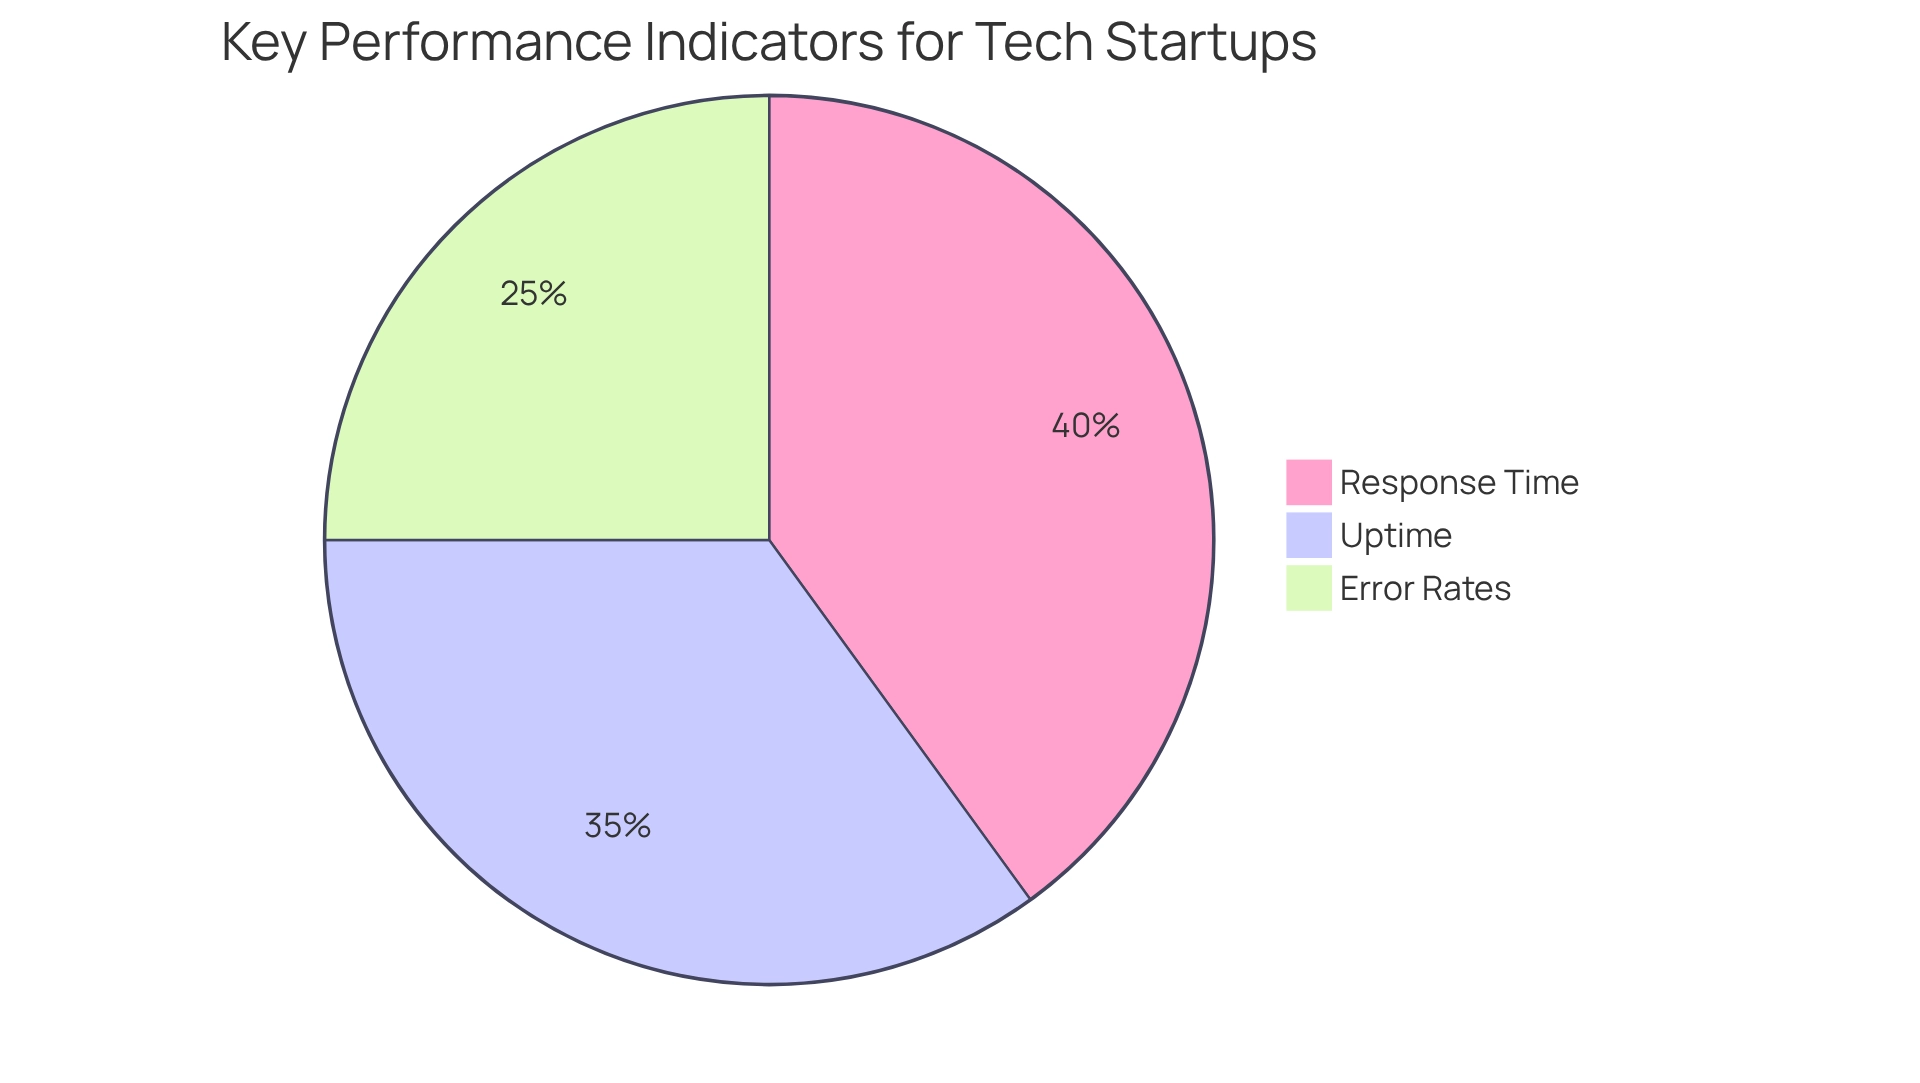
Tech startups often face the challenge of effectively monitoring essential performance indicators, such as response time, uptime, and error rates. These metrics are essential for gaining real-time insights into the performance of digital products. In 2025, the average response time for digital products is expected to play a critical role in customer satisfaction. Studies reveal that even a one-second delay can lead to a 7% decrease in conversions. Moreover, maintaining high uptime metric—ideally exceeding 99.9%—is vital for ensuring that users have continuous access to services, directly impacting customer retention and loyalty. Dynatrace's service performance metrics empower new businesses to swiftly detect and address performance issues, enhancing customer satisfaction and promoting growth. For instance, startups that have embraced Dynatrace report remarkable improvements in their service performance. One case study highlighted a 40% reduction in response times after adopting real-time monitoring solutions. This proactive approach not only enriches user experience but also enables businesses to adapt quickly to market demands.
As the global entrepreneurial economy flourishes, valued at $3.8 trillion in 2024, the importance of real-time performance monitoring cannot be overstated. By focusing on these essential performance indicators, technology companies can ensure they remain competitive and agile in an ever-evolving digital landscape. With consumers expected to in 2024, optimizing performance through tools like Dynatrace is crucial for capturing and retaining market share. Additionally, considering that about 30% of venture-backed companies face failure, effectively tracking performance indicators becomes vital to avoid common pitfalls and secure sustainable growth.
Publication Metrics: Evaluating Traditional and Altmetrics
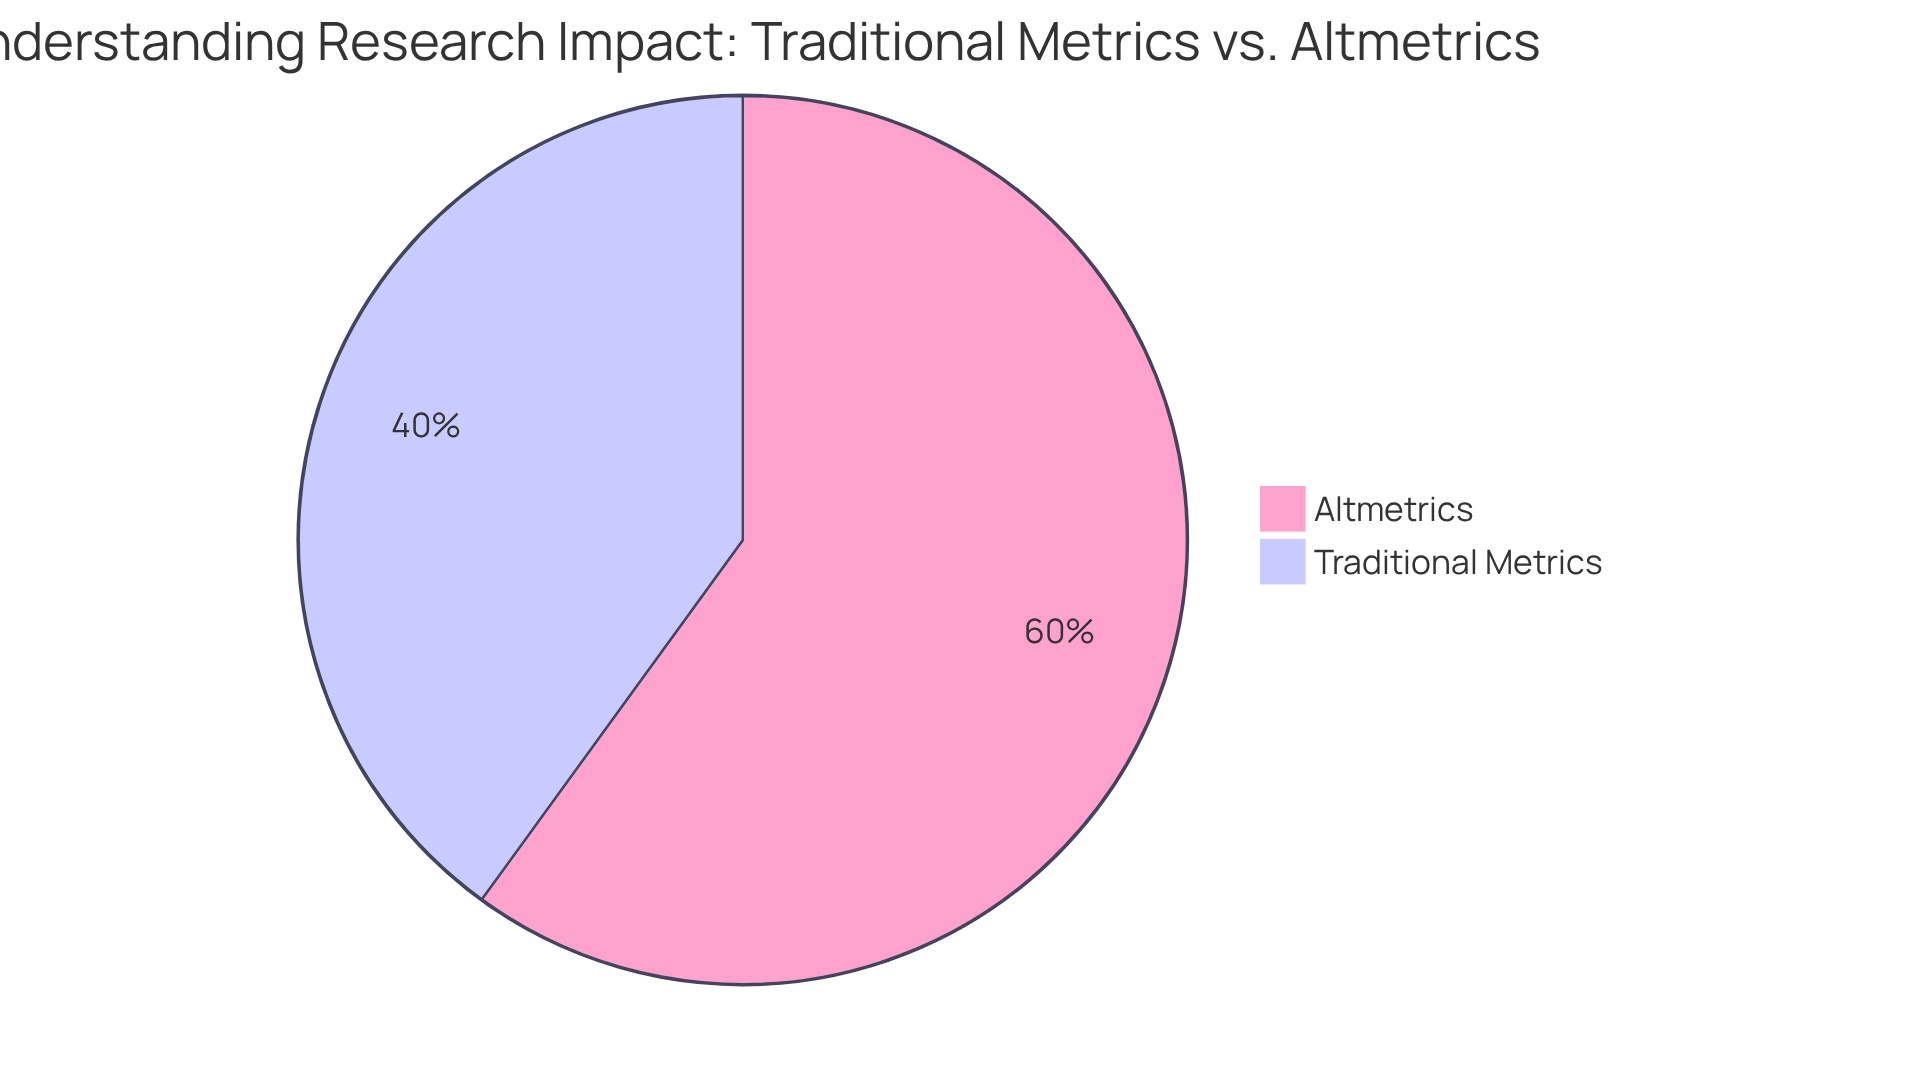
For many startups, assessing the impact of their research can feel overwhelming. Relying solely on conventional measures, like citation counts, often leaves founders wondering if they’re truly capturing the full picture. This can lead to feelings of uncertainty about how their work is perceived.
By incorporating altmetrics, such as social media mentions and downloads, startups can gain a more comprehensive understanding of their research's impact as a metric. This dual approach not only illuminates how their work resonates in both academic and public spheres but also provides a metric for .
It enhances overall brand visibility, allowing founders to feel more connected to their audience. Embracing this holistic view can truly empower startups, nurturing their growth and visibility in a supportive way.
Adverity: Essential Ad Delivery Metrics for Digital Marketing
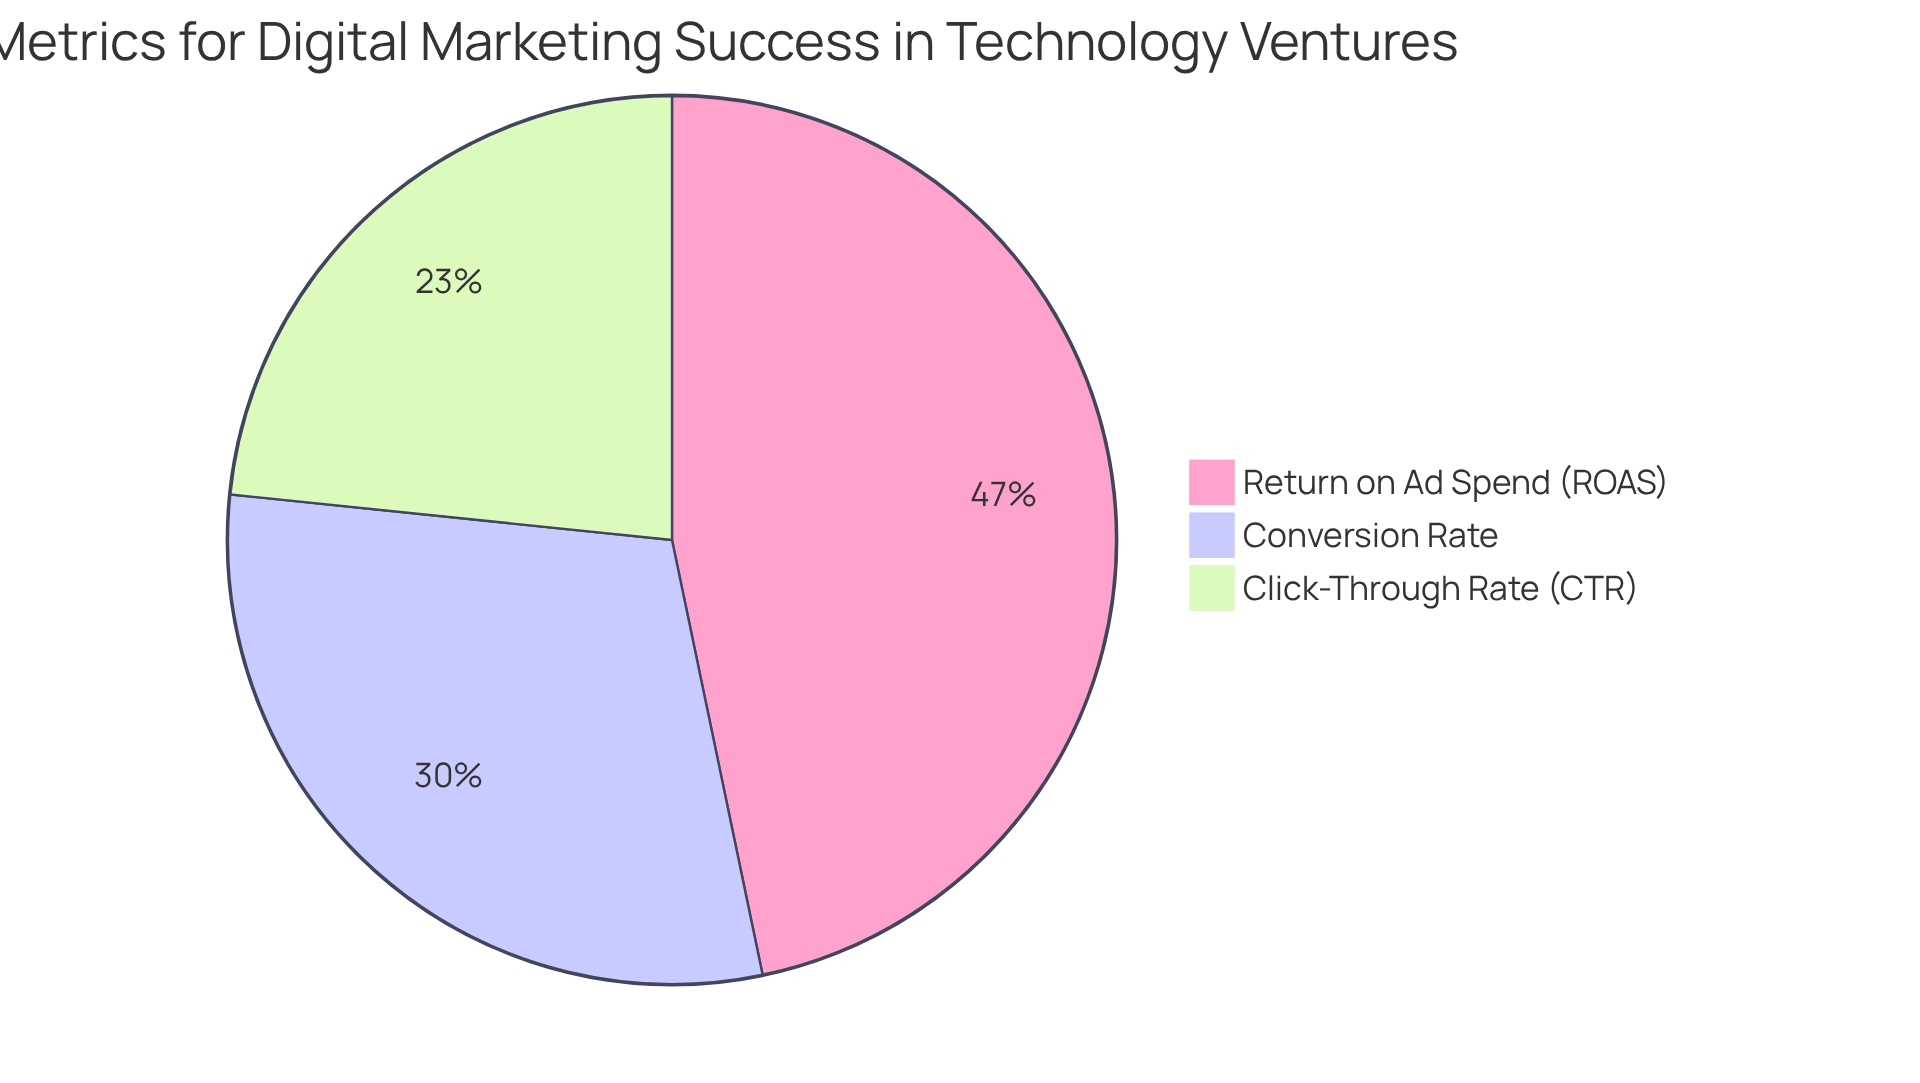
For technology ventures, focusing on key metric indicators such as click-through rates (CTR), conversion rates, and return on ad spend (ROAS) is essential for assessing the success of digital marketing campaigns. In 2025, the average CTR for new technology ventures is expected to be around 2.5%. This figure underscores the pressing need for effective advertising strategies. Similarly, conversion rates, a key metric that indicates the percentage of users who take a desired action, are crucial; new businesses should anticipate an average conversion rate of about 3.2% for their advertising efforts this year.
Navigating these metrics can feel overwhelming, but utilizing tools like Adverity can empower new businesses to collect and analyze these metric measurements effectively. This promotes data-driven decisions that refine marketing strategies. Many case studies reveal that startups employing Adverity have seen significant improvements in their marketing outcomes, gaining better visibility into their campaign effectiveness.
The significance of click-through rates and conversion rates cannot be overlooked. High CTRs not only signify effective ad engagement but also correlate with improved conversion rates, ultimately resulting in a higher ROAS. As David Meerman Scott wisely noted, modern web marketing emphasizes delivering valuable content at the right moment, making these metrics indispensable for new businesses eager to strengthen their online presence. Moreover, incorporating employee-generated content (EGC) has emerged as a powerful strategy that utilizes these metrics for enhancing authenticity and engagement. EGC often surpasses official brand accounts in reach and interaction, offering a cost-effective way for startups to foster trust while managing their marketing budgets. Recent findings show that EGC plays a significant role in building consumer trust, making it a vital element of . As consumer preferences shift—especially with the growing popularity of short-form videos, which 66% of consumers find more engaging—startups must adapt their strategies to leverage these insights effectively. It’s also important to remember that SEO is a long-term commitment that requires patience and consistent effort, which is crucial for sustainable growth in digital marketing.
Tandfonline: Article Metrics for Content Impact Assessment
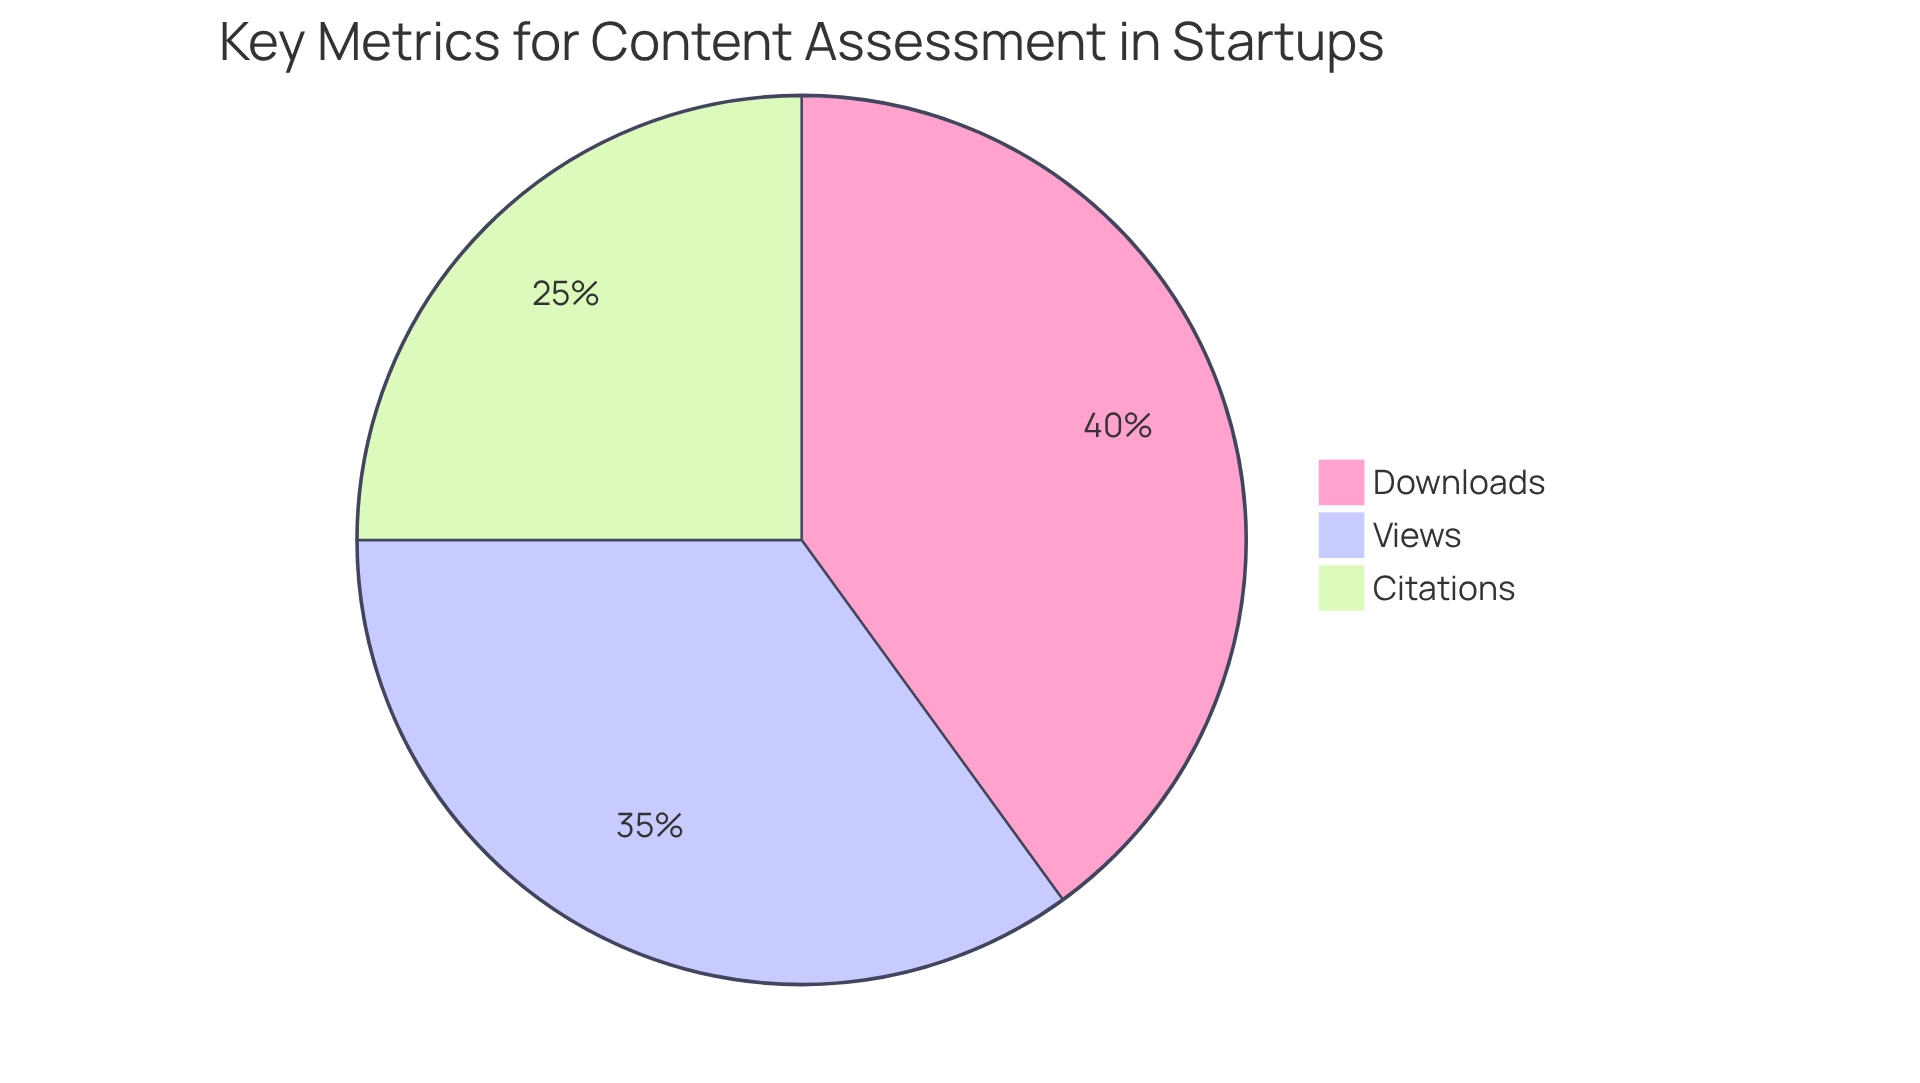
Startups often face the challenge of effectively assessing their published content, which can lead to missed opportunities for growth. By utilizing article statistics—such as downloads, views, and citations—these businesses can gain valuable insights into their audience's preferences. This understanding is crucial, as it allows for strategic adjustments that enhance engagement and impact. Looking ahead to 2025, we anticipate a significant rise in average downloads for technology company articles, underscoring the importance of these metrics in shaping our content strategies.
Moreover, with the global entrepreneurial economy valued at $3.8 trillion—an increase from $3.1 trillion in 2023—grasping the dynamics of content consumption is more vital than ever for fostering growth. Successful content strategies increasingly rely on these metric insights, providing a window into audience behaviors and interests. As Bela Gupta D’Souza, Founder, shared, "We took a big leap of faith with Appinventiv who helped us translate our vision into reality with the perfectly comprehensive Edamama eCommerce solution." By focusing on downloads and views, new ventures can evaluate their content's reach and refine their strategies to maximize impact, cultivating deeper connections with their audience.
Additionally, significant trends affecting the next generation of innovators in the entrepreneurial ecosystem highlight the necessity of adapting content approaches to meet evolving consumer needs. The case study titled '' further illustrates how advanced technologies and shifting behaviors are redefining content strategies within the technology entrepreneurial landscape. Together, we can navigate these changes and embrace a future of growth and connection.
Engagement Metrics: Key Indicators for User Retention
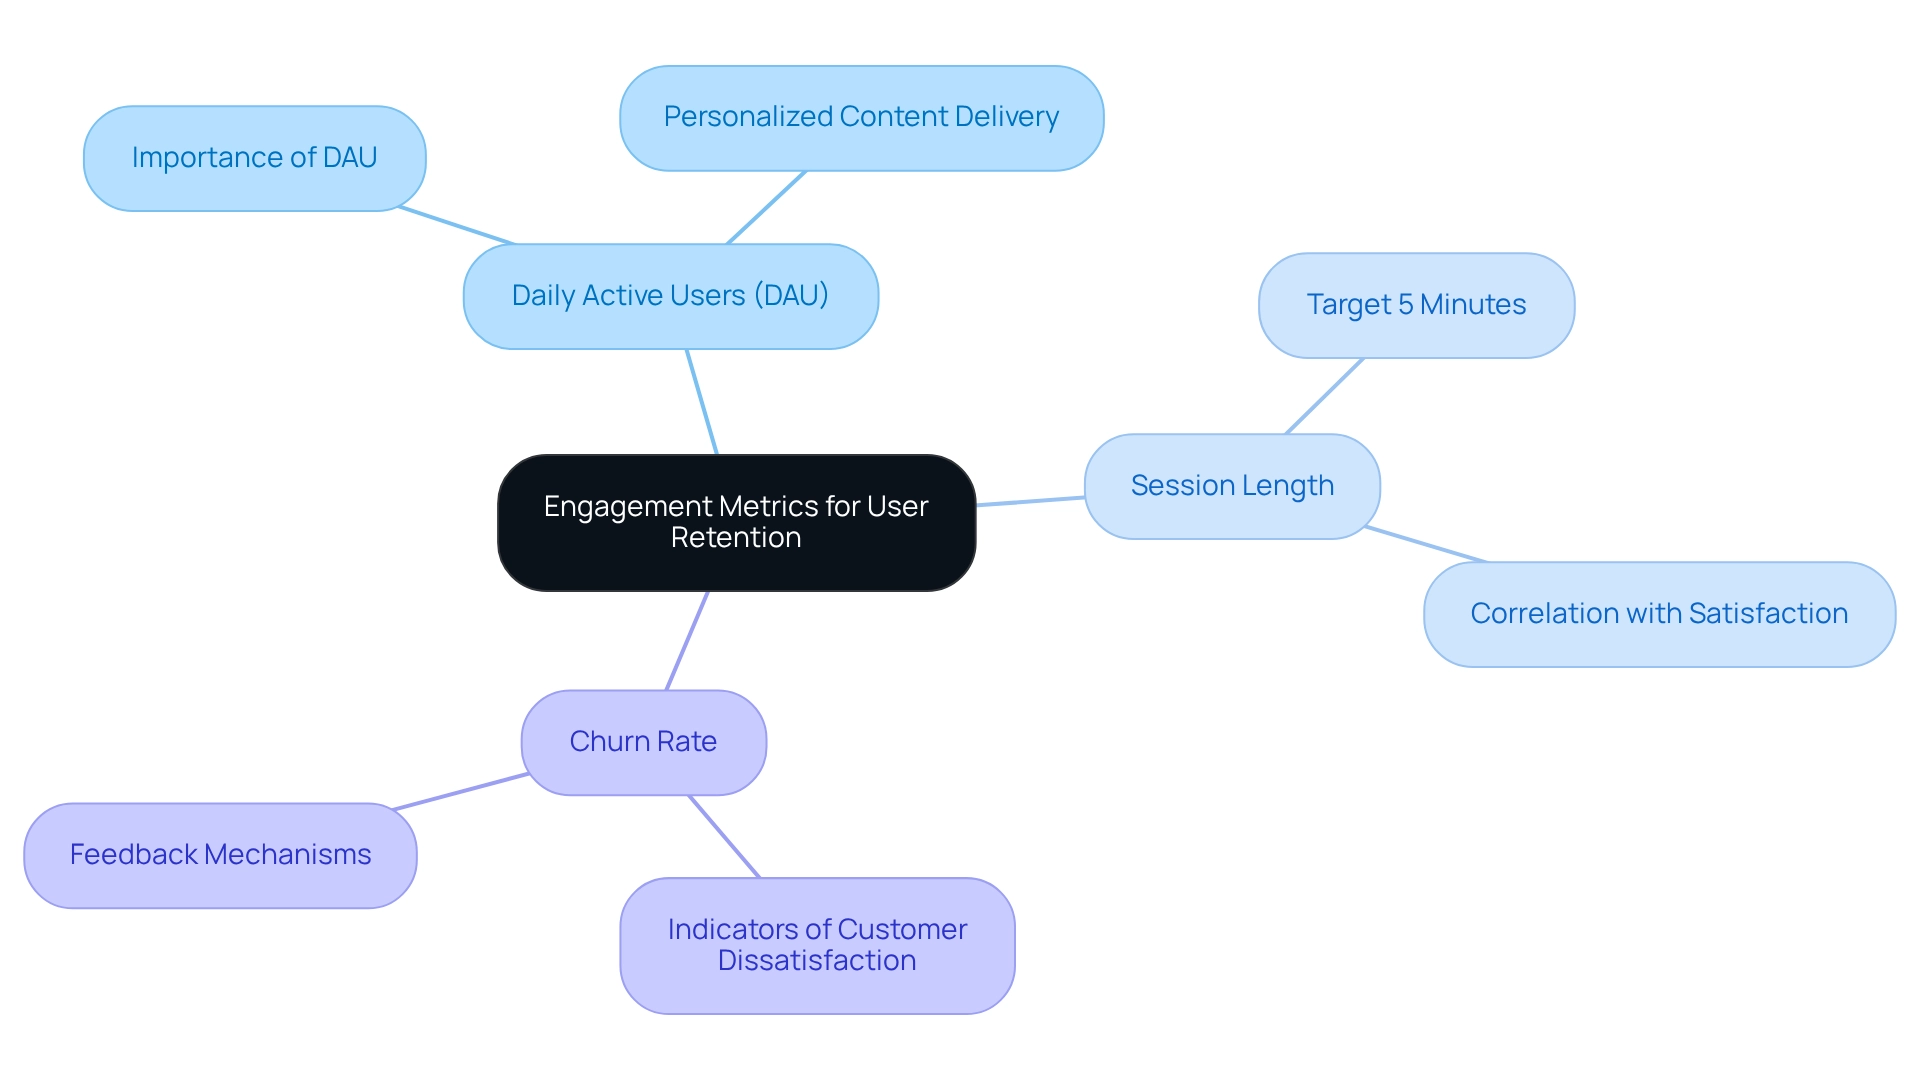
For technology enterprises, tracking engagement metrics like daily active participants (DAU), session length, and churn rate is not just important—it's essential for nurturing customer retention. DAU serves as a crucial indicator of engagement, reflecting the number of unique individuals interacting with the application each day. As we look toward 2025, technology ventures are expected to average around 1,000 daily active participants, underscoring the competitive landscape where maintaining interest is paramount.
Consider session duration, which measures how long participants engage with an application. Startups should aim for an average session length of at least 5 minutes, as longer sessions often correlate with higher satisfaction and retention rates. By closely examining these metrics, new businesses can gain valuable insights into consumer behavior and preferences, empowering them to tailor their offerings effectively. To enhance customer experience based on the metric of DAU and churn rate, effective strategies may include:
- Personalized content delivery
- Streamlined onboarding processes
- Regular updates that keep the application fresh and engaging
For instance, Asian smart city enterprises are projected to generate about 50% of global income in their sector by 2025, driven by innovative engagement strategies leveraging IoT technology.
Understanding the is equally vital. A high churn rate can indicate customer dissatisfaction or disengagement, prompting businesses to seek client feedback and make necessary adjustments. RNO1’s commitment to transparent communication and collaborative project management helps prevent scope creep, allowing new businesses to focus on refining their engagement strategies. Expert insights reinforce that prioritizing engagement metrics is crucial for customer retention, as they provide a clear perspective on how effectively a new business meets its clients' needs. To effectively implement these insights, technology companies should regularly evaluate their engagement metrics and adapt their strategies accordingly. By diligently monitoring DAU and session duration, they can adopt effective approaches to enhance user experience, ultimately fostering growth and ensuring long-term success in an ever-evolving digital landscape.
SCImago Journal Rank: Measuring Journal Impact for Research
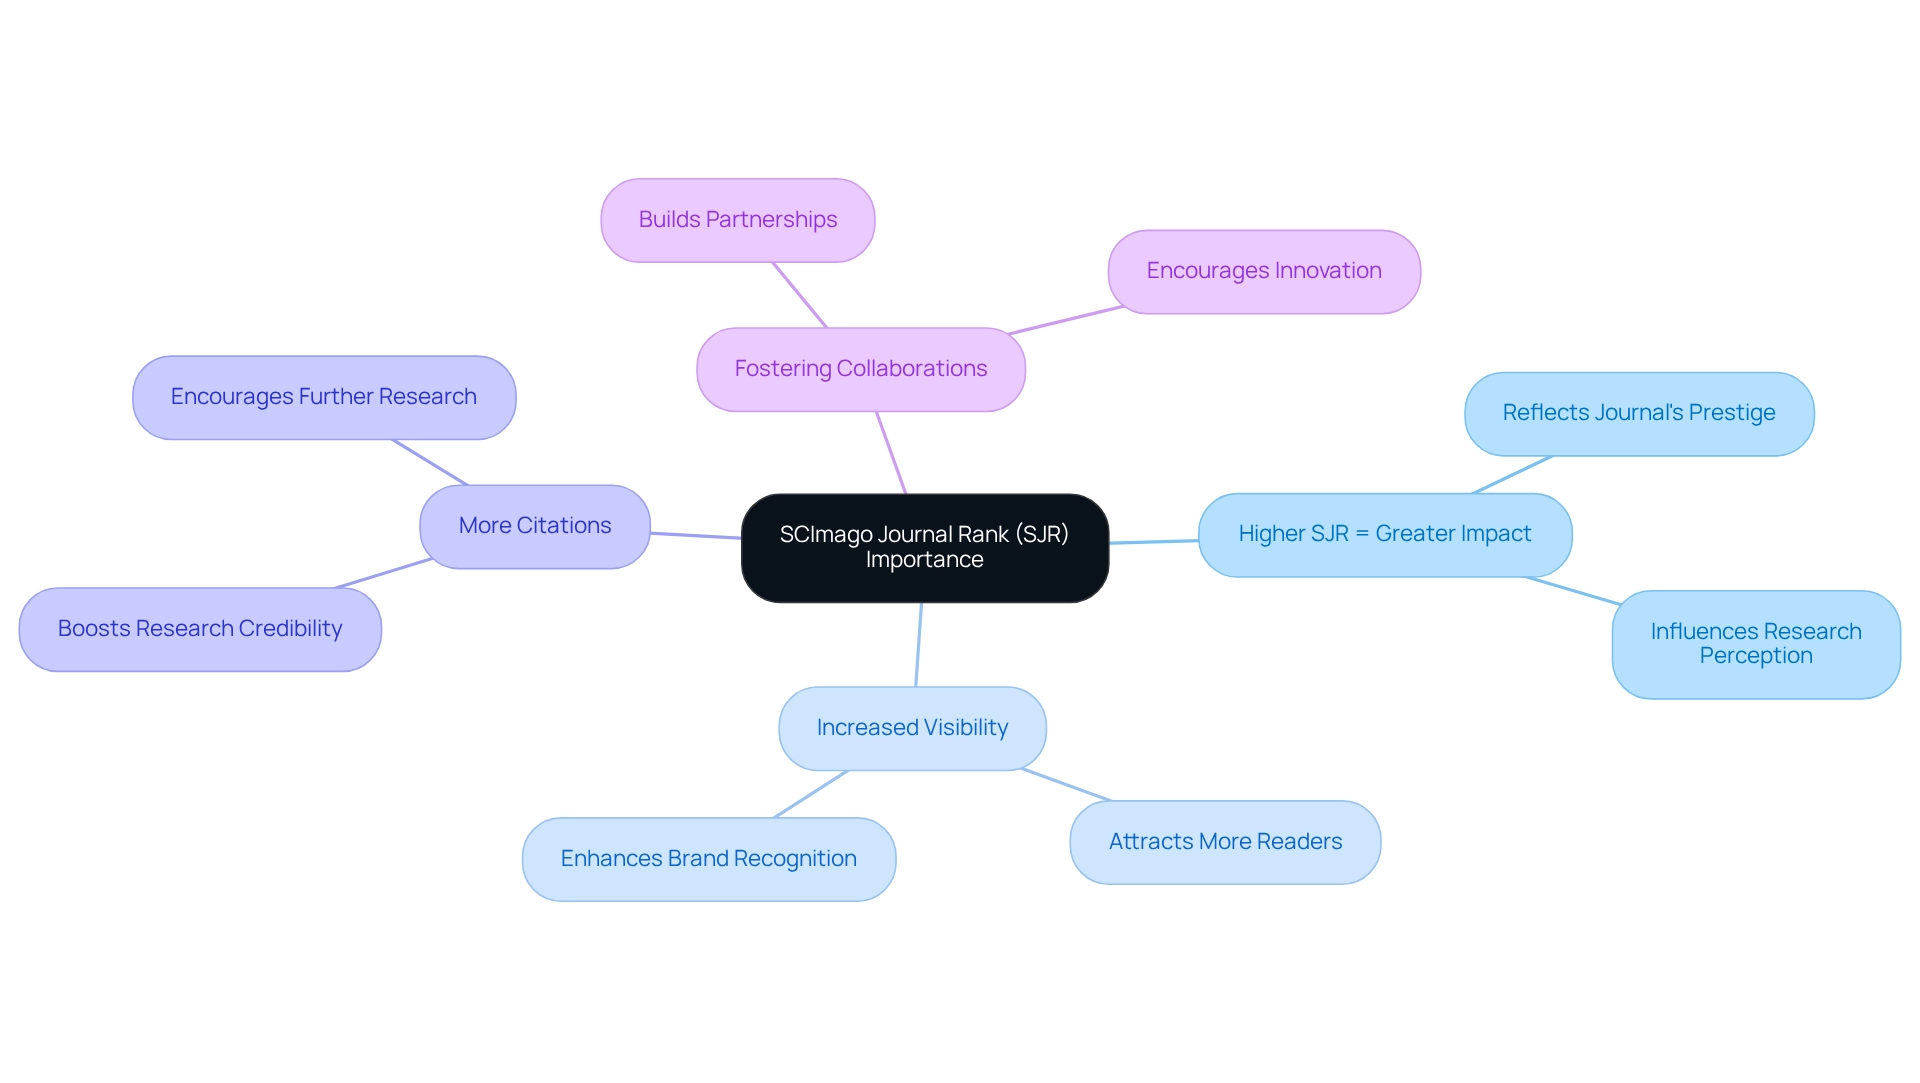
For many startups, navigating the world of research publication can feel overwhelming. The challenge of ensuring that their work is recognized and valued is a common concern. This is where (SJR) comes into play. Understanding that a higher SJR serves as a crucial metric reflecting a journal's impact and prestige can be a game changer.
By choosing to publish in journals with a strong SJR metric, startups can significantly enhance the visibility of their research. This, in turn, attracts more citations and fosters collaborations, which are crucial for growth and innovation. It's important to remember that every citation and partnership can pave the way for new opportunities.
By considering SJR when publishing, startups not only elevate their work but also nurture their potential for success. We at RNO1 are here to support you in this journey, helping you make informed decisions that can truly make a difference.
Analytics Tools: Segmenting Audiences for Targeted Strategies
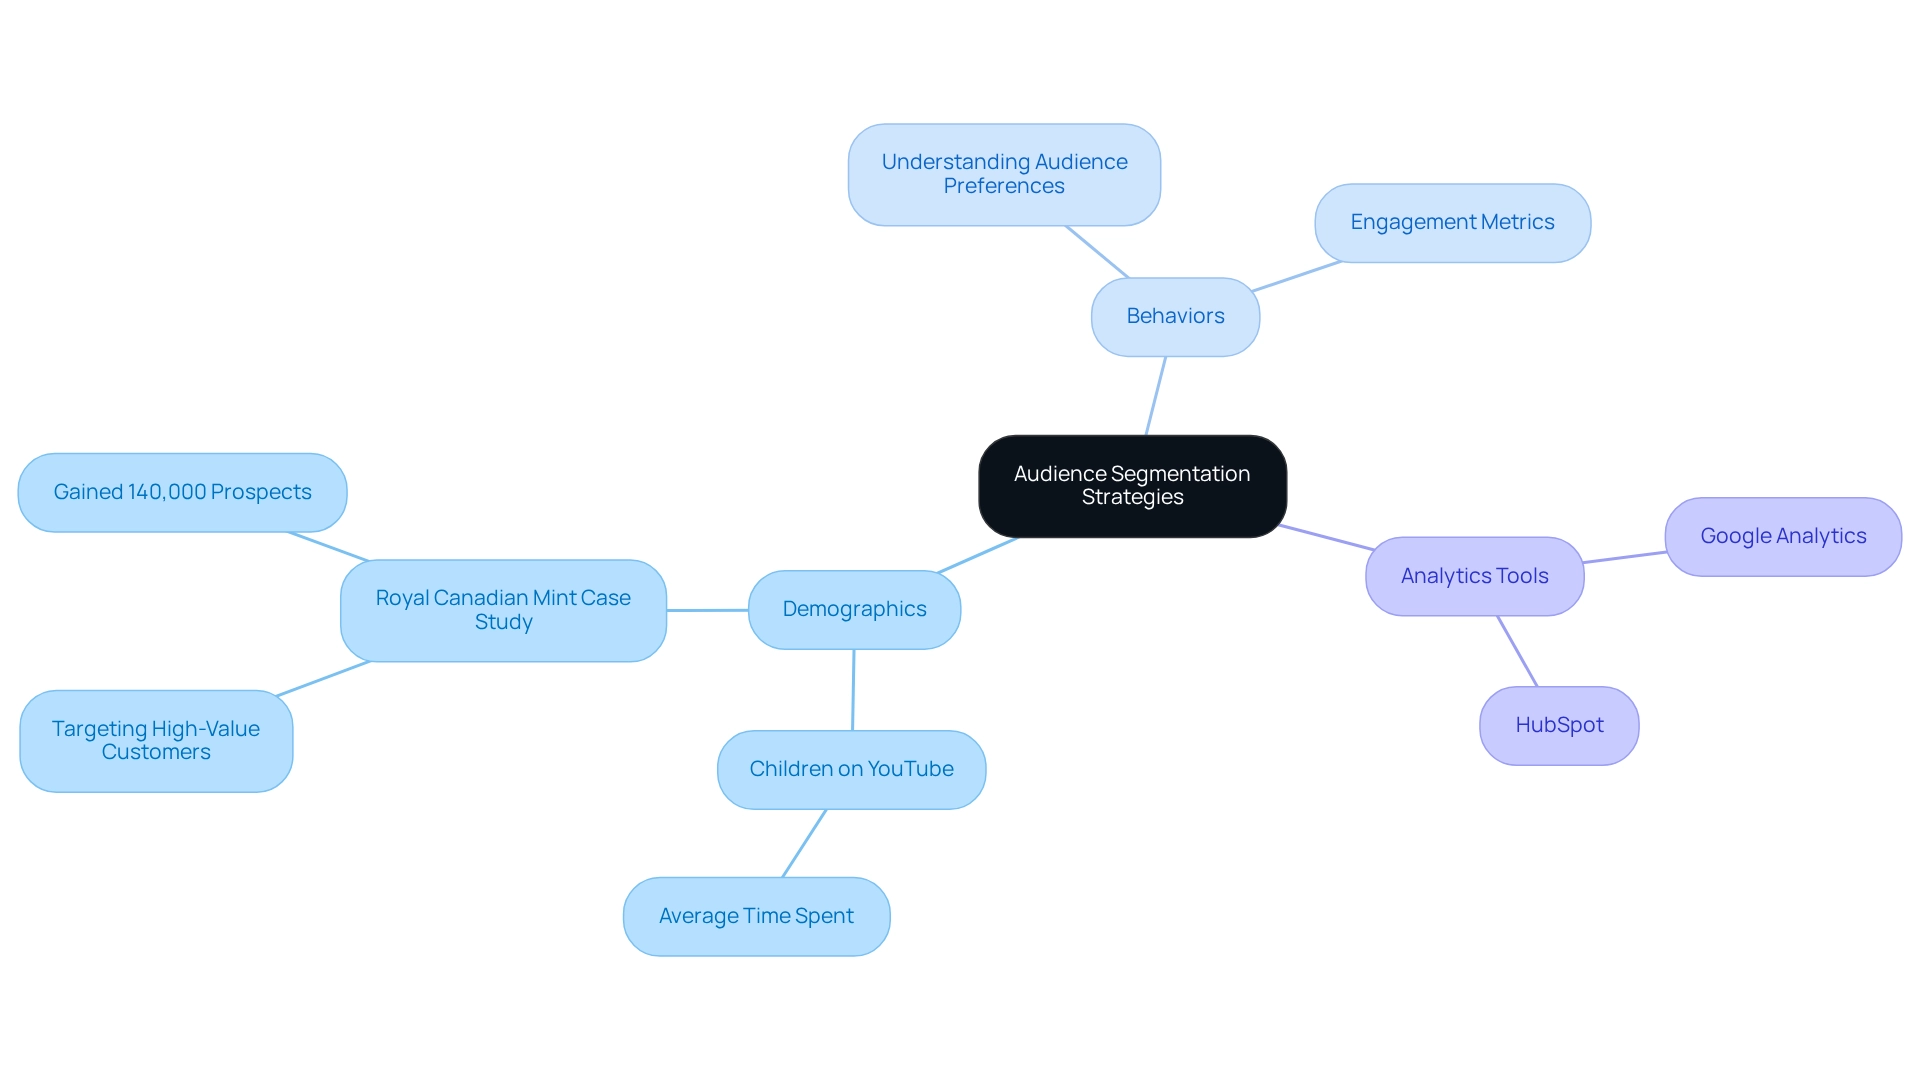
Tech companies often face the challenge of improving their marketing effectiveness metrics. This can be particularly daunting for new businesses trying to make their mark. However, by utilizing analytics tools such as Google Analytics and HubSpot, they can segment their audiences based on demographics, behaviors, and preferences. This segmentation is not just a technical step; it’s essential for connecting with specific groups, ultimately enhancing engagement and conversions, which serve as a key metric for success.
Demographic segmentation, in particular, plays a vital role in developing targeted marketing plans. By analyzing data through a metric analysis, new businesses can uncover key characteristics of their audience, allowing them to create personalized campaigns that resonate with their needs and interests. For example, the Royal Canadian Mint successfully employed segmentation metrics to identify and target prospects similar to their highest-value customers, resulting in an impressive gain of 140,000 prospects in a single marketing campaign.
Looking ahead to 2025, understanding audience behavior metrics will be more critical than ever. With platforms like TikTok projected to generate $33.1 billion in advertising revenue, it becomes increasingly important for new businesses to implement efficient audience segmentation techniques. By grasping their audience's preferences and behaviors, they can craft content that truly resonates, which serves as a metric for maximizing their advertising investments.
Additionally, demographic trends reveal that in the UK, children spend an average of 66 minutes daily on YouTube. This statistic underscores the importance of targeting younger audiences through tailored content. Startups can leverage this knowledge to develop engaging campaigns that capture the attention of potential customers early on, and expert insights further emphasize the importance of analytics as a metric in audience segmentation.
As Leigh Ann Tucker observed, RNO1's results-oriented method focuses on achieving success through cooperative techniques that are metric-based, ultimately improving digital marketing efficiency. By employing tools like Google Analytics and HubSpot, technology companies can refine their audience segmentation metric and ensure their marketing efforts align with .
To effectively implement these strategies, tech startup founders should regularly analyze their audience data and adjust their campaigns based on real-time insights, ensuring they remain relevant and impactful. Remember, you are not alone in this journey; with the right tools and support, you can navigate the complexities of marketing and connect meaningfully with your audience.
Conclusion
In the fast-paced world of tech startups, many founders grapple with the overwhelming challenge of monitoring the right metrics for sustainable growth. It’s easy to feel lost amidst the myriad of data points, and the pressure to succeed can weigh heavily. Brand awareness, customer perception, and engagement levels are vital, yet often overlooked in the hustle. By honing in on key performance indicators like Net Promoter Score and Customer Lifetime Value, you can truly understand how well you resonate with your audience. This understanding is not just about numbers; it’s about refining your branding strategies to create meaningful connections.
The insights gained from research impact metrics, such as the h-index and i10-index, are equally significant. They enhance your credibility and attract potential investors, providing reassurance that your efforts are recognized. Understanding reader engagement through metrics like page views and time spent on articles allows you to adapt your content strategies, ensuring that your voice resonates with your audience. Tools like Dynatrace can help monitor performance metrics, ensuring that your digital products meet user expectations, thus enhancing customer satisfaction and retention.
Moreover, evaluating both traditional and altmetrics offers a comprehensive view of your research impact. This, combined with targeted marketing strategies informed by audience segmentation, can significantly boost engagement and conversion rates. As the digital landscape continues to evolve, leveraging analytics tools is essential for adapting to changing consumer behaviors and preferences.
Ultimately, the strategic use of metrics across branding, research, engagement, and performance is crucial for tech startups striving to thrive in a competitive market. By continuously monitoring and adapting your strategies based on these insights, you can foster deeper connections with your audience, drive growth, and secure your place in the marketplace. Embracing a data-driven approach is not merely beneficial; it is essential for navigating the complexities of the tech startup ecosystem. Remember, you are not alone on this journey; together, we can navigate these challenges and find the path to success.
Frequently Asked Questions
What challenges do tech companies face regarding metric data?
Tech companies often struggle with prioritizing metric data such as brand awareness, customer perception, and engagement levels, which are crucial for driving growth, especially for startups in a competitive landscape.
What are key performance indicators (KPIs) for tech startups?
Key performance indicators for tech startups include Net Promoter Score (NPS) and Customer Lifetime Value (CLV), which help assess how well a brand resonates with its audience.
What is the average NPS for tech startups as of 2025?
As of 2025, the average NPS for tech startups stands at approximately 30, reflecting a growing emphasis on customer satisfaction and loyalty.
How many impressions are needed for effective brand awareness?
Startups need to deliver at least 6 to 7 impressions to their target audience to achieve effective brand awareness.
How does brand perception affect recruitment?
Brand perception plays a significant role in attracting talent, as 82% of prospective candidates consider a brand's reputation before applying for a position.
What approach does RNO1 suggest for branding strategies?
RNO1 emphasizes the ongoing observation and adjustment of branding strategies to align with market trends and consumer expectations.
How can tech companies enhance their branding efforts?
Successful tech companies leverage NPS and CLV to refine their branding efforts and ensure they meet the evolving needs of their customers.
What is the significance of trust for Gen Z consumers?
A recent study found that 44% of Gen Z consumers are more comfortable sharing personal information when they trust a brand's security practices, highlighting the importance of establishing trust in the digital era.
What benefits do effective branding approaches provide?
Effective branding approaches boost customer loyalty and promote sustainable growth, positioning technology companies for long-term success in a competitive environment.
How can startups continuously improve their branding strategies?
Startups can enhance their branding efforts by implementing regular feedback loops with their audience to adapt and refine their strategies continuously.


