

Introduction
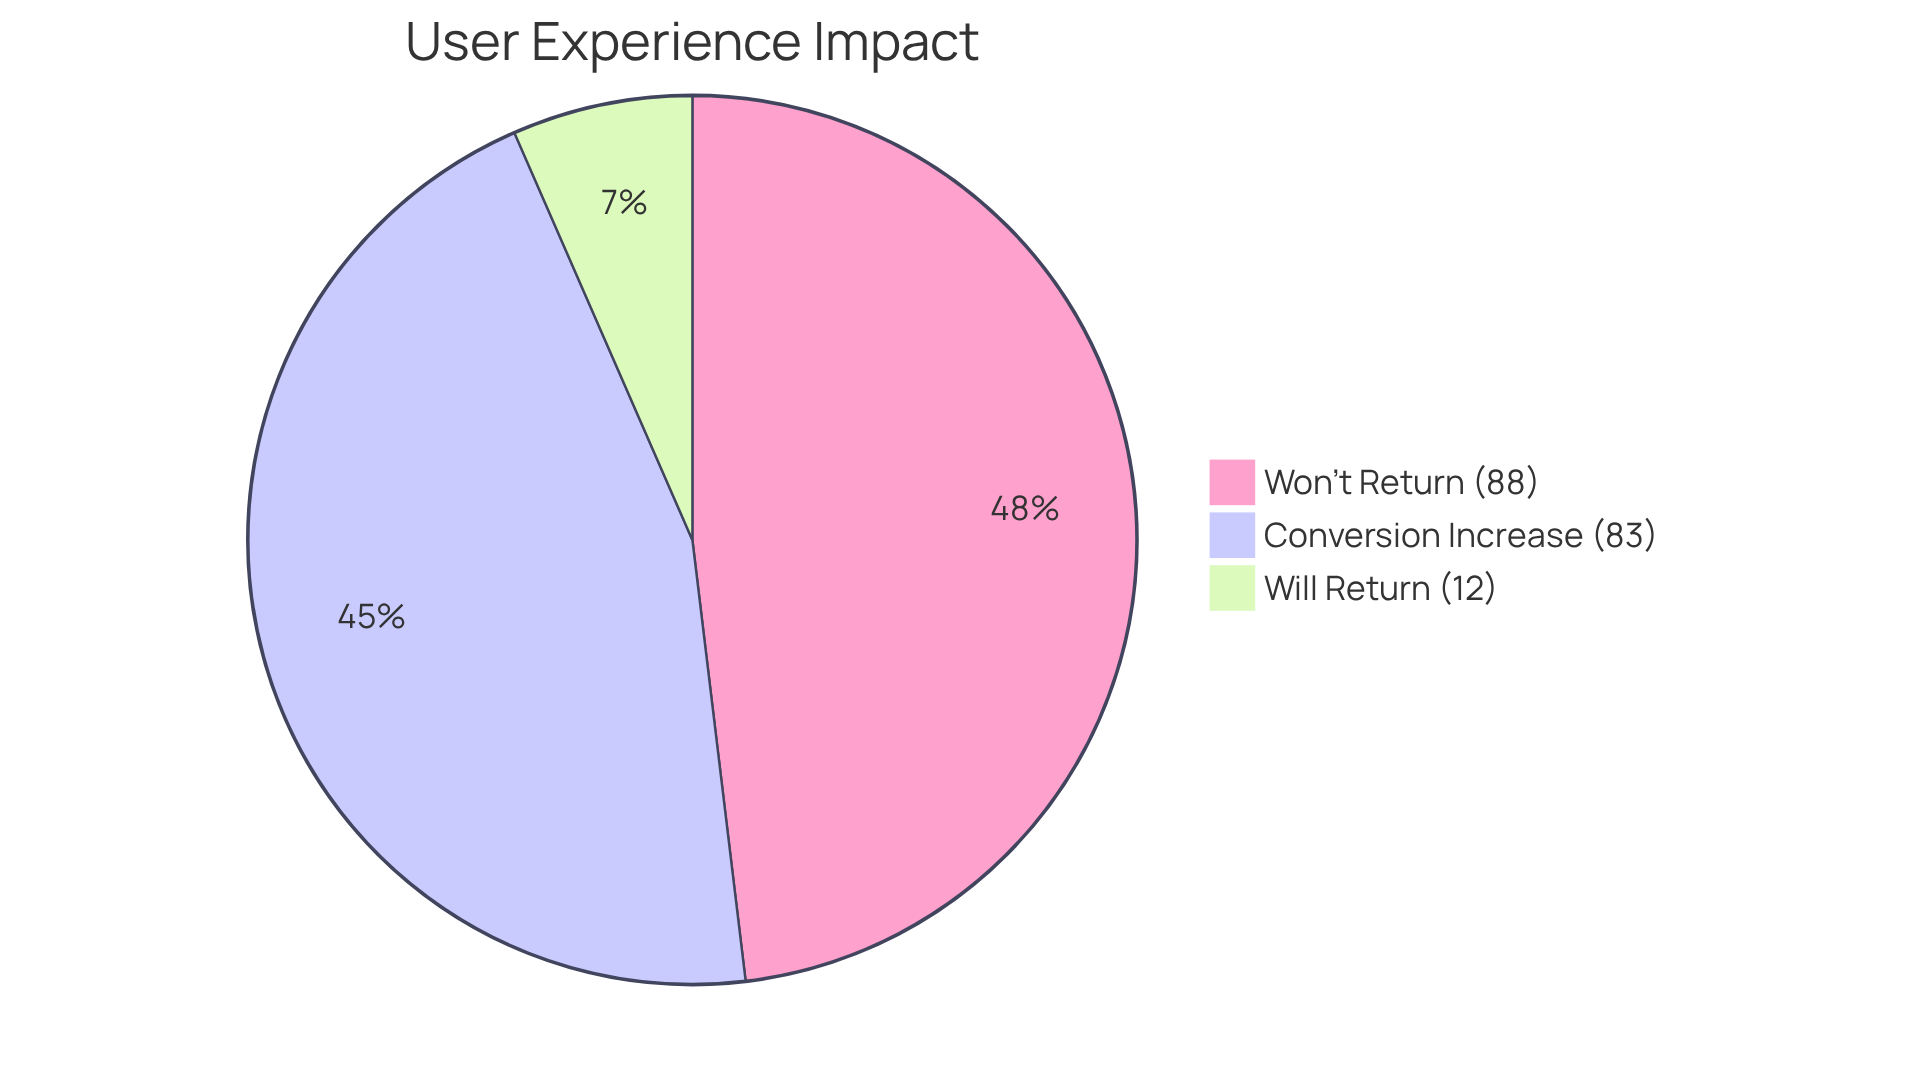
Have you ever felt frustrated when navigating a poorly designed dashboard? In the fast-paced world of tech startups, user engagement hinges on intuitive and visually appealing interfaces. With a staggering 88% of users likely to abandon a platform after a negative experience, the stakes are incredibly high.
Let’s look at some inspiring dashboard design examples that have transformed user experiences and driven brand performance, just like those we’ve seen at RNO1.
How can you, as a startup founder, use these design principles to create deeper connections with your users and build lasting loyalty?
RNO1: Transformative Dashboard Design for Modern Brands
Have you ever felt frustrated when users don’t engage with your platform as you hoped? At RNO1, we understand that creating a visual interface that truly resonates with your audience can be a daunting task. It’s disheartening to know that 88% of users won’t return after a negative experience, isn’t it? This statistic highlights the importance of effective dashboard examples design for retaining clients.
By merging advanced UX principles with a strong focus on usability, we aim to transform your interface into a tool that empowers your users to make informed decisions. Our philosophy emphasizes clarity, visual hierarchy, and actionable insights, enabling seamless navigation through complex data landscapes. Notable projects, such as those with Interos and CoVenture, showcase our ability to deliver tailored solutions that resonate with the distinct needs of both tech startups and established enterprises.
Moreover, organizations that prioritize user experience have been shown to exceed the S&P by 228% from 2004 to 2014. This underscores how our innovative approaches contribute to your success. As Annemarie Bufe, a UX experience expert, wisely states, 'Boosting the UX development budget by 10% can lead to an 83% increase in conversions.'
We’re committed to working alongside you, ensuring that every visual representation not only meets but exceeds your expectations, enhancing engagement and nurturing brand loyalty. Imagine transforming your user experience into a powerful tool that not only retains clients but also builds lasting loyalty. With our design-driven solutions and 'Radical Digital Experiences™', RNO1 is here to support your journey in digital brand transformation and innovative experiences for modern enterprises.
Plausible: User-Friendly Analytics Dashboard Design
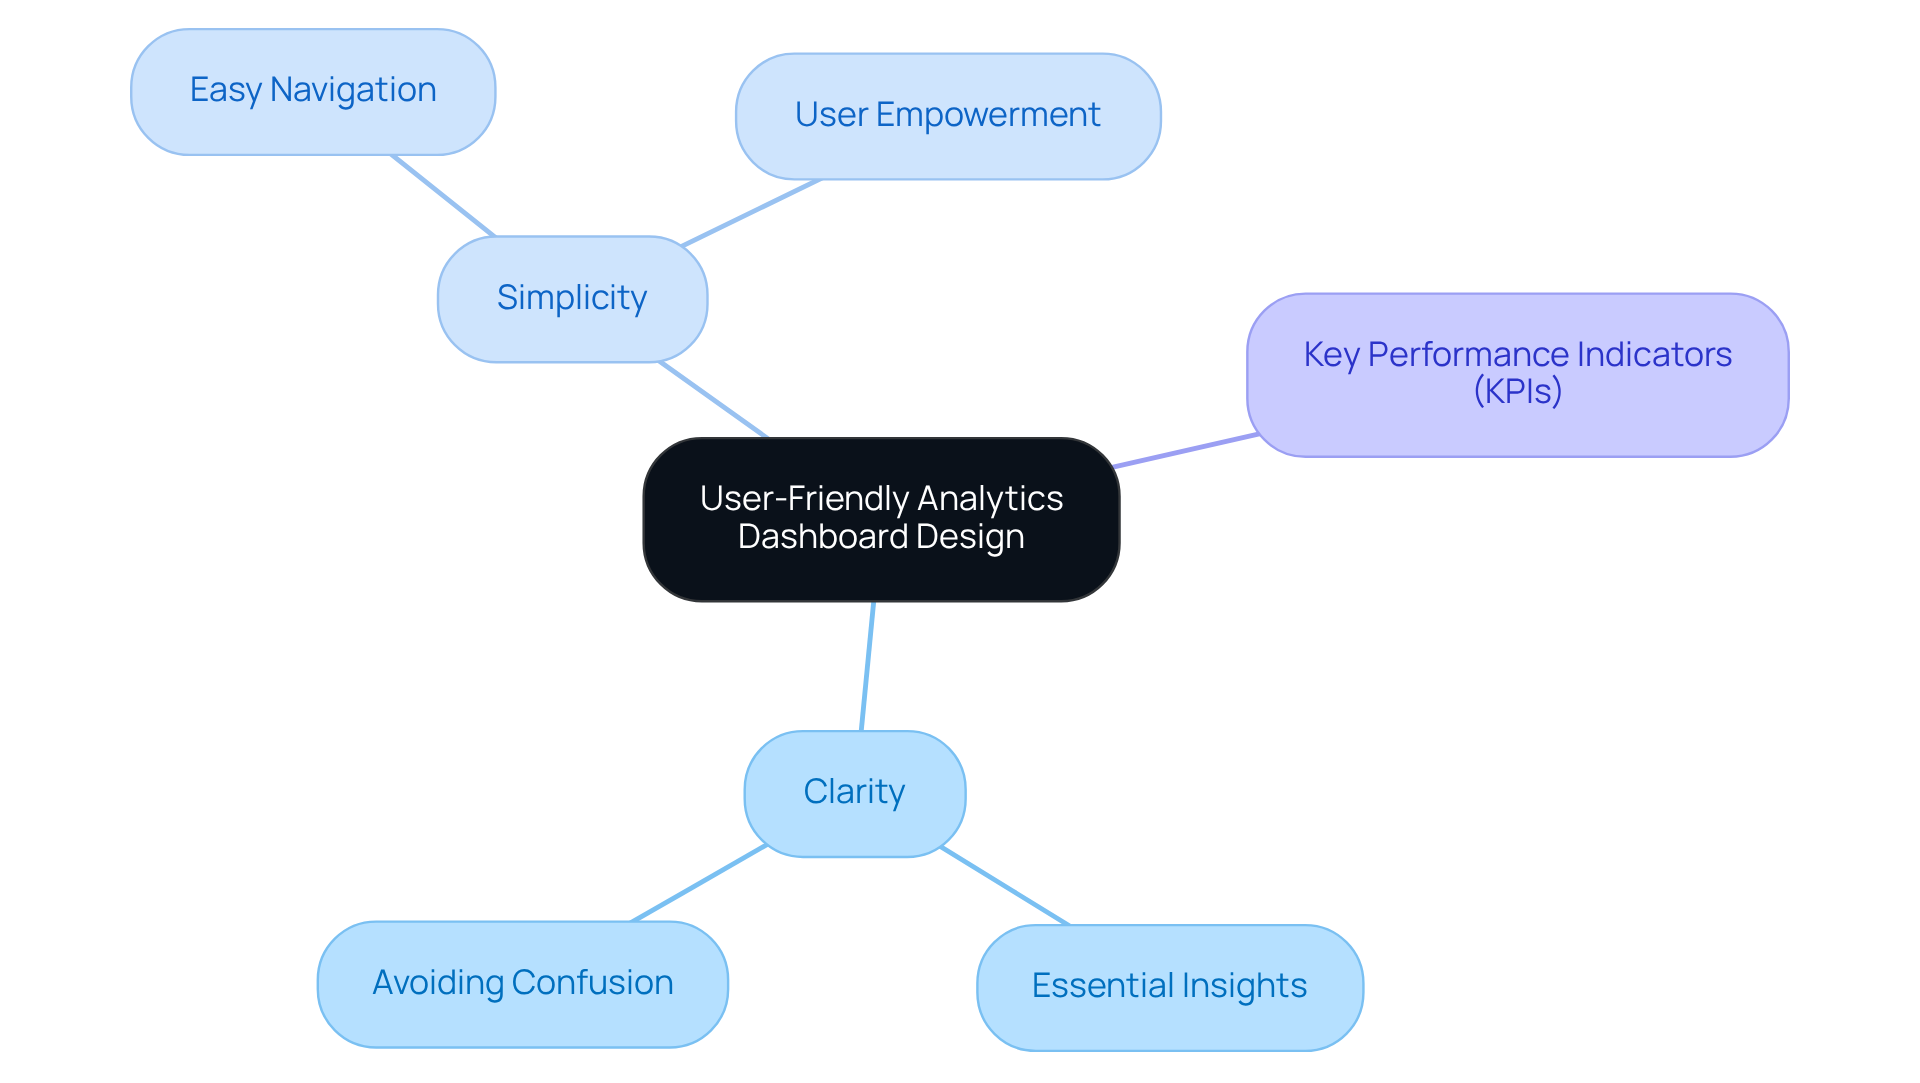
Have you ever felt overwhelmed by complex analytics that seem to cloud your decision-making? Plausible's analytics interface is designed with you in mind, making it easy to find what you need without feeling lost in a sea of data. We believe that simplicity is key, ensuring you can navigate your analytics effortlessly. Imagine being able to grasp the essential insights you need in just a few seconds-no more confusion, just clarity.
Edward Tufte reminds us that clarity in information presentation is crucial; poor design can lead to frustration rather than understanding. Case studies show that focusing on high-level alerts and key performance indicators (KPIs) allows for rapid insights.
With Plausible, you can finally breathe easy, knowing that clarity and simplicity are at your fingertips, empowering you to make informed choices without the stress of data overload.
Grafana: Customizable Dashboards for Data Visualization
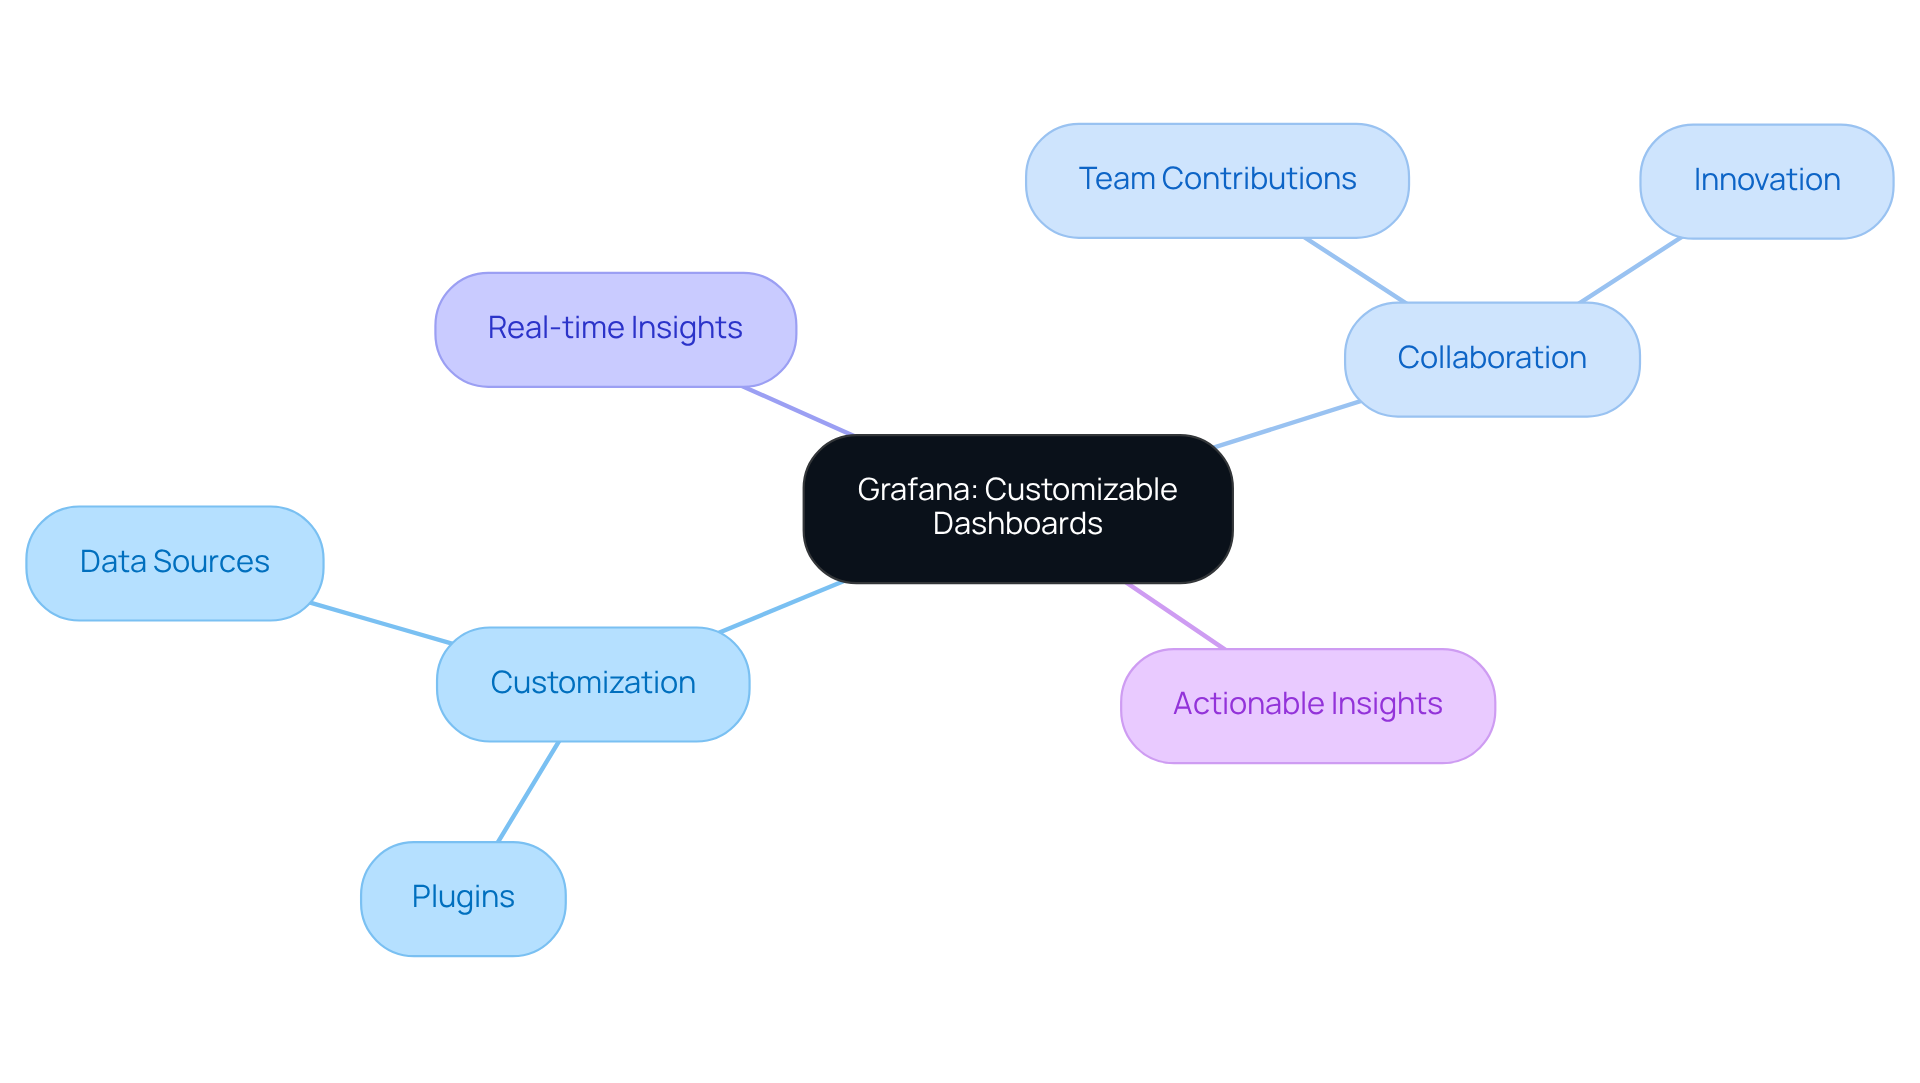
Many startups find themselves overwhelmed by the rapid pace of change in customer expectations. Grafana offers a solution by providing a tool that lets you customize your dashboards just the way you need them. With a broad array of plugins and data sources, it empowers tech startups to create visualizations that accurately represent their unique metrics and KPIs. This adaptability is crucial for businesses that need real-time insights and the flexibility to modify their interfaces as their requirements change.
Many startups find themselves overwhelmed by the rapid pace of change in customer expectations, highlighting the necessity for tools that can adapt swiftly. With Grafana, even if you're not a tech whiz, you can easily create and tweak dashboard examples designed to meet your team's needs, fostering a collaborative environment where everyone can contribute to driving innovation and enhancing decision-making.
As you seek to make sense of your data, Grafana becomes your trusted partner, helping you turn insights into action. Moreover, case studies indicate that tailored experiences can greatly enhance engagement, establishing Grafana as an essential ally in navigating the intricacies of visualization. By embracing Grafana, startups can transform their data into actionable insights, paving the way for innovation and growth.
Kibana: Visualizing Data with Stunning Dashboards
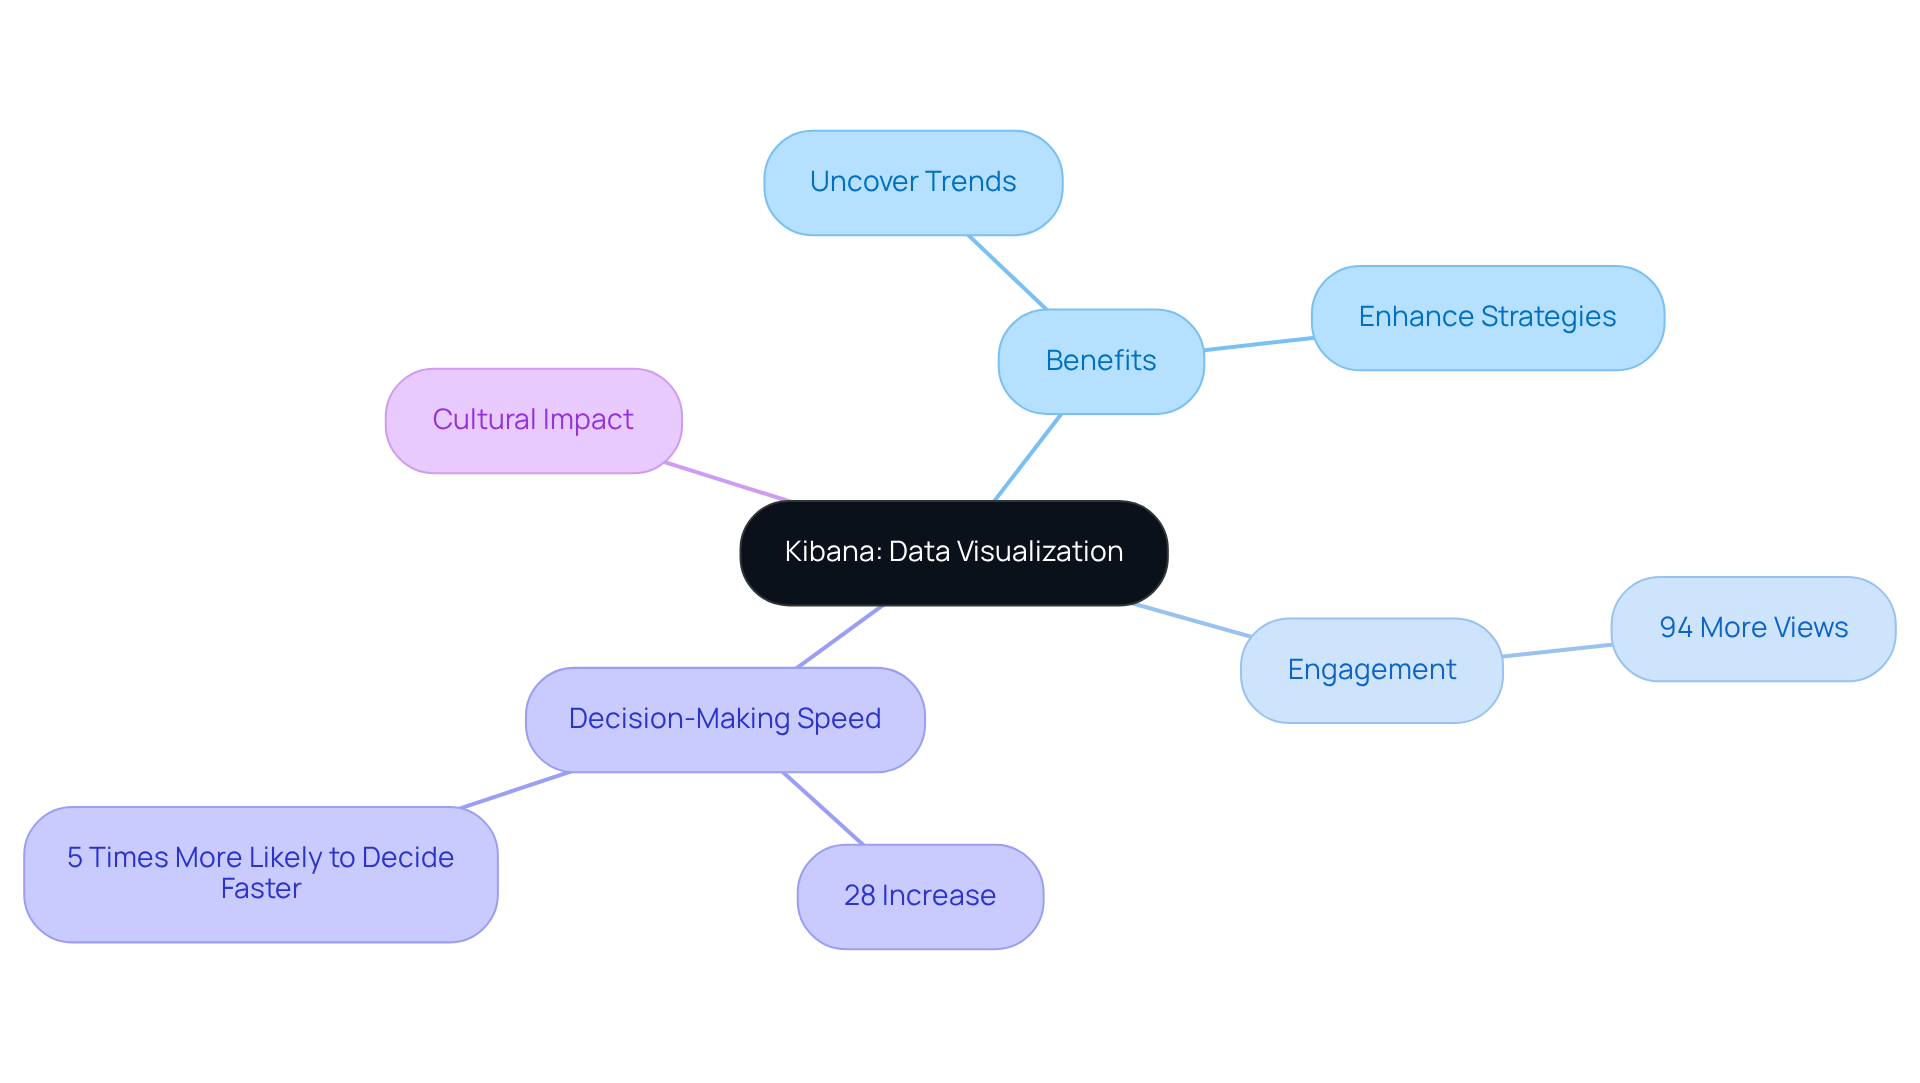
Many startups struggle to make sense of their complex data, often feeling overwhelmed by the sheer volume of information available. Kibana helps startups like yours turn complex data into beautiful, easy-to-understand dashboard examples design that tell a story. This approach not only makes data more engaging but also helps you uncover valuable trends and insights that can guide your decisions.
You might be surprised to learn that posts with engaging visuals get 94% more views - imagine the impact that could have on your startup! Furthermore, businesses that utilize visualization tools report a 28% increase in decision-making speed, and companies employing visualization are five times more likely to make quicker decisions than their rivals.
By embracing these visualization techniques, startups can not only enhance their analytical strategies but also foster a culture of informed decision-making that sets them apart from the competition.
Odoo: Integrated Business Dashboards for Enhanced Functionality
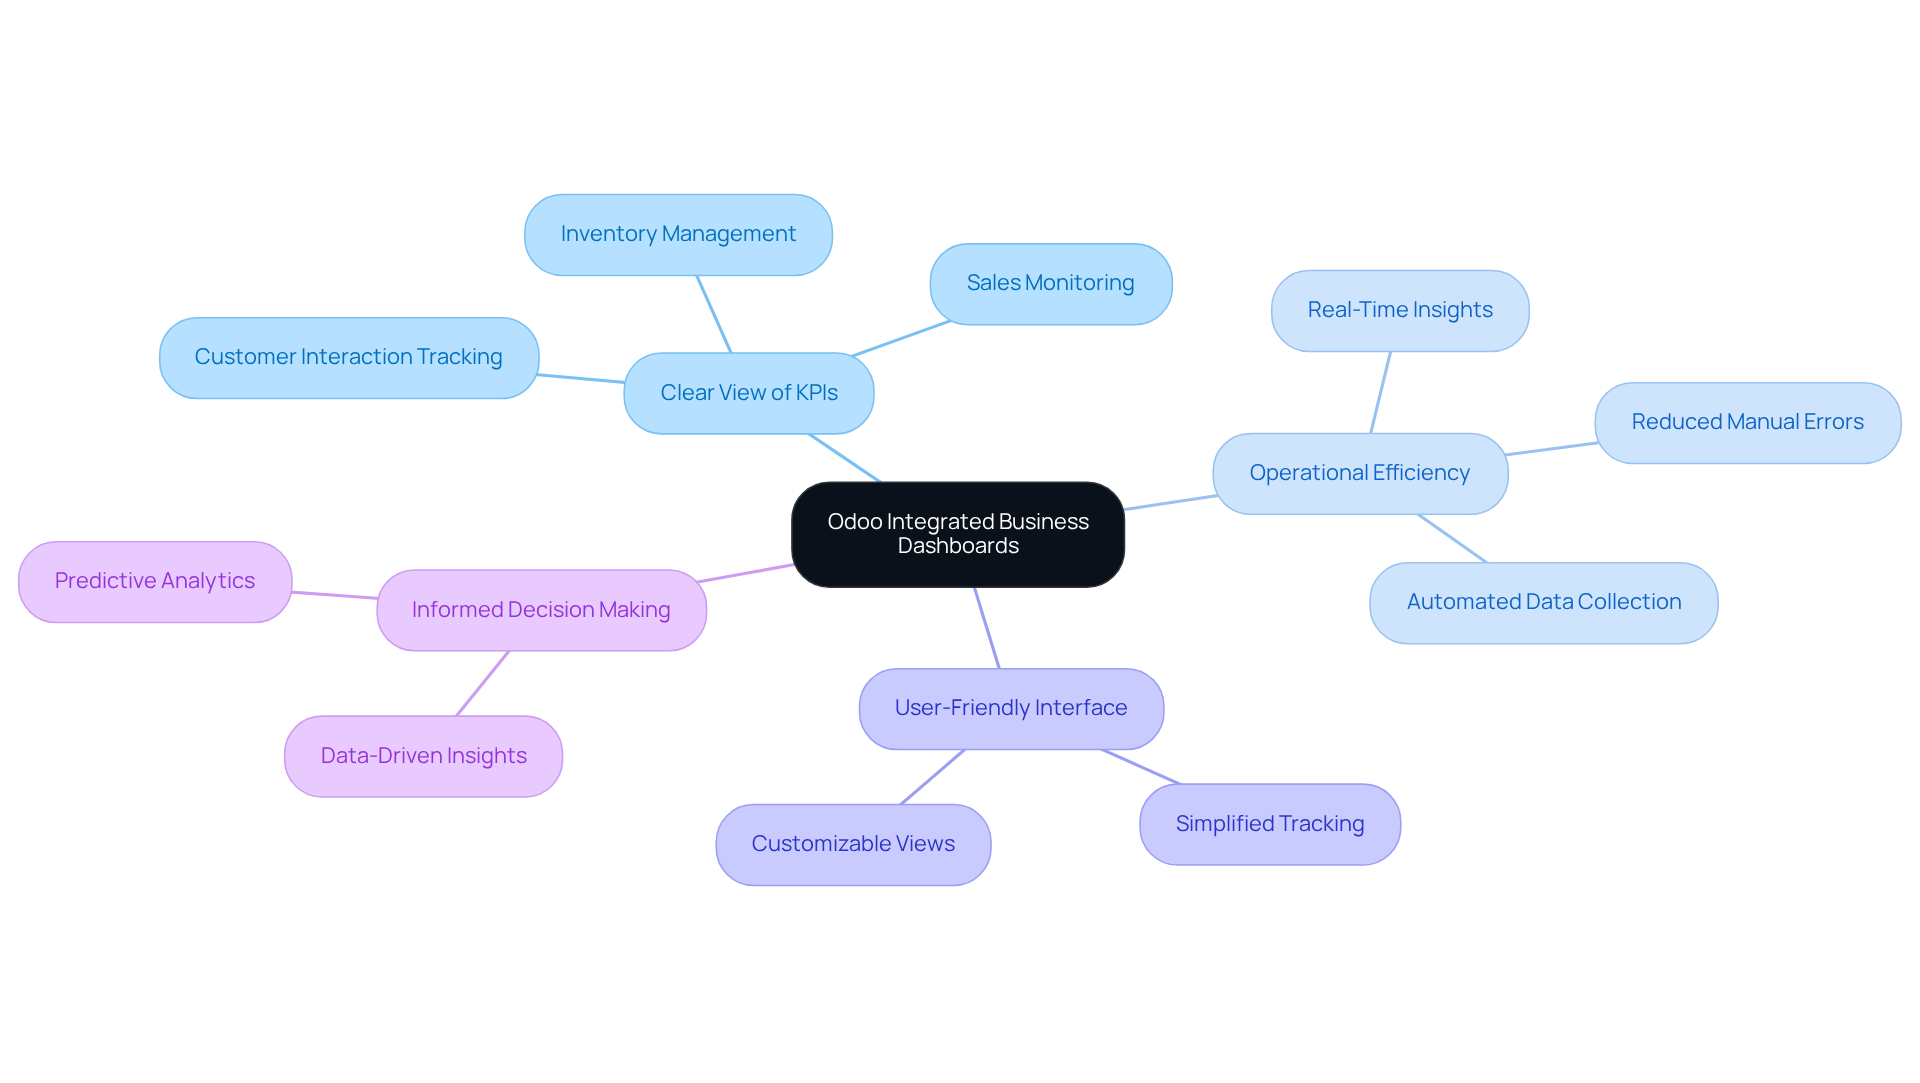
Are you feeling overwhelmed by the complexities of managing your startup's operations? Odoo provides dashboard examples design that feature integrated business interfaces, allowing you to have a clear view of your key performance indicators and making it easier to navigate your challenges.
With this all-in-one approach, you can effortlessly monitor your sales, inventory, and customer interactions, freeing you to focus on what truly matters - growing your business. Centralizing your data with Odoo's visual interfaces and utilizing dashboard examples design not only enhances your operational efficiency but also empowers you to make informed decisions with confidence.
You'll appreciate Odoo's user-friendly interface, which simplifies tracking your performance metrics and helps you identify areas for improvement, featuring various dashboard examples design that make your journey a little easier.
Imagine the peace of mind that comes with having all your critical data at your fingertips, empowering you to make confident decisions.
Home Assistant: Smart Home Dashboard Design
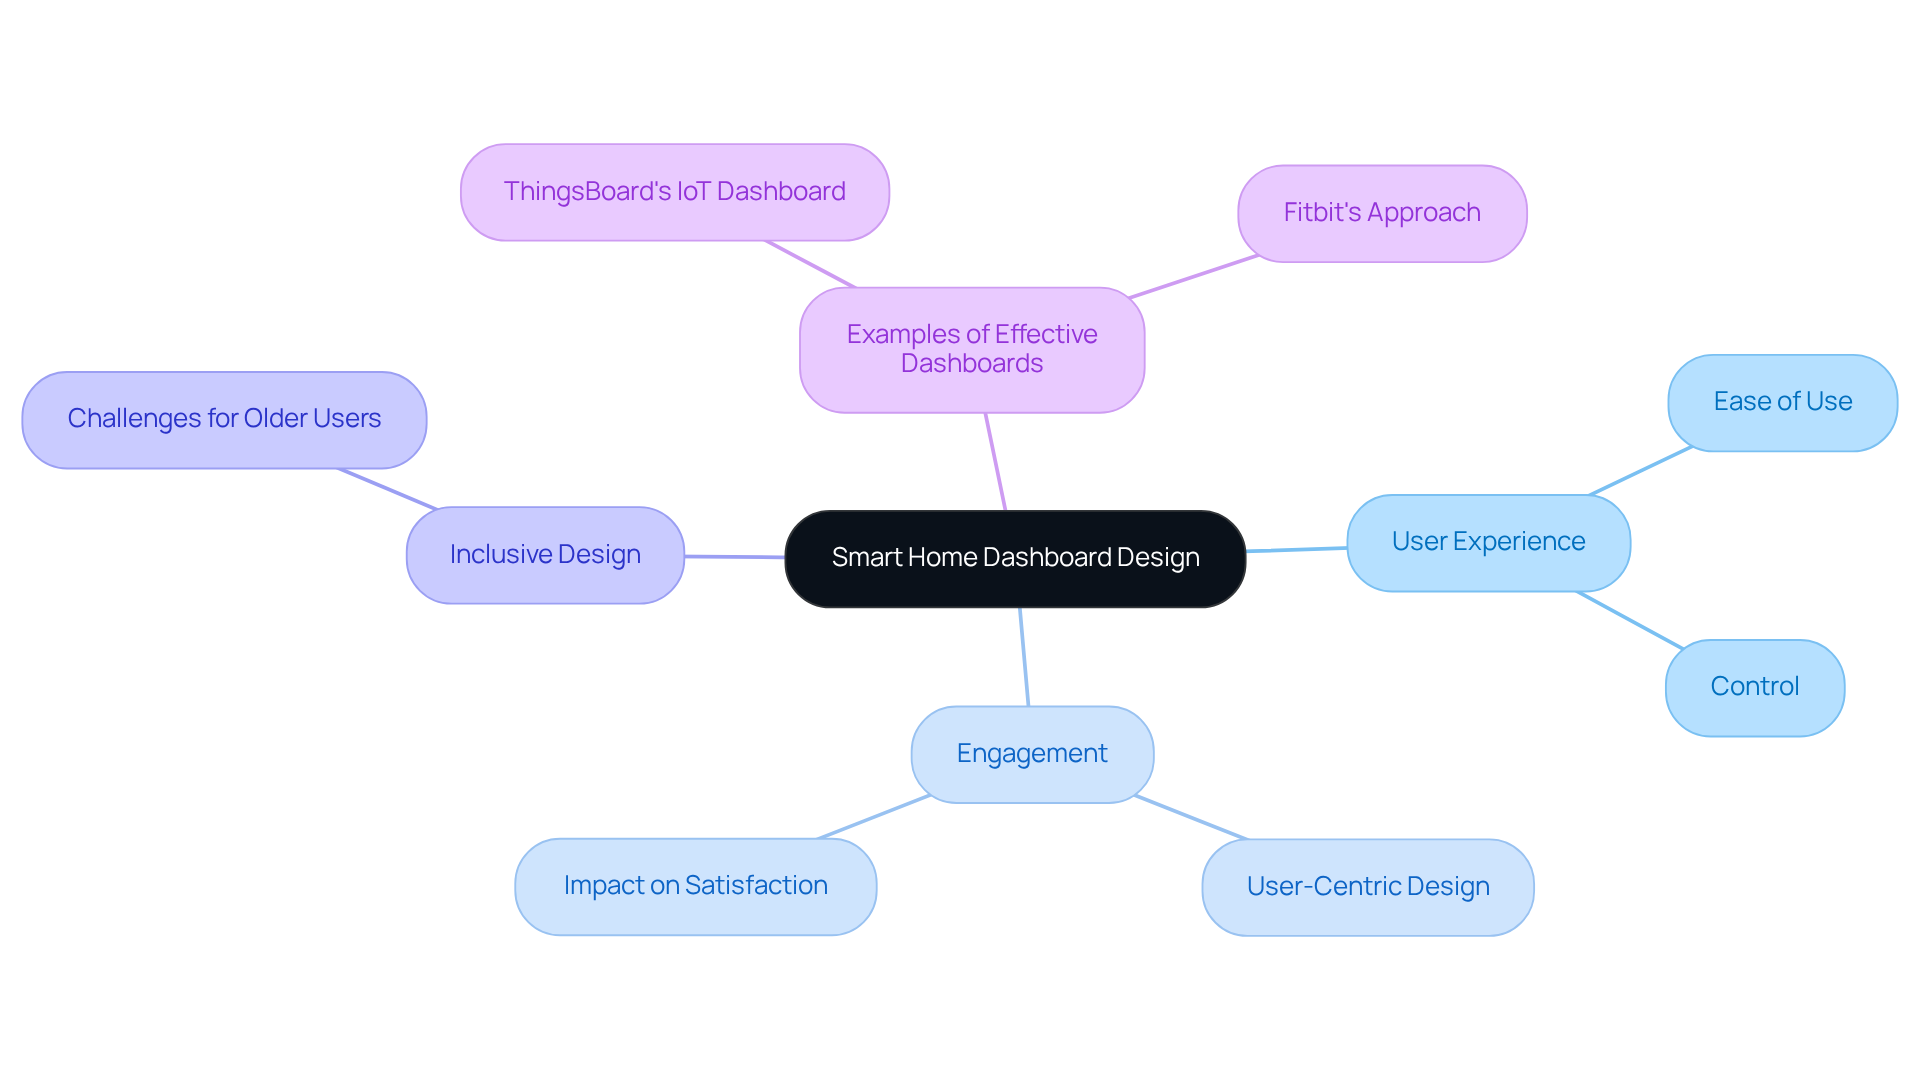
Have you ever felt overwhelmed trying to manage multiple smart devices in your home? Home Assistant offers a solution that feels like a breath of fresh air. Imagine having a single dashboard examples design that allows you to control all your smart devices with ease, making your home feel more connected and manageable. This approach not only enhances your experience but also invites you to engage more deeply with the technology that can simplify your life.
For startups in the IoT sector, looking at Home Assistant's approach can inspire you to create interfaces that truly resonate with users, making their lives easier and more enjoyable. Research shows that when interfaces are designed with users in mind, like Fitbit's approach, engagement naturally improves, leading to happier, more satisfied customers.
Take ThingsBoard's IoT Dashboard as a prime example of dashboard examples design; it’s a great illustration of how thoughtful design can boost efficiency and make users feel more in control of their environment. Experts like Anthony Irwin remind us that when we empower users with intuitive designs, we’re not just creating products; we’re enhancing lives and fostering independence.
Dr. Melissa Gregg highlights the importance of addressing the unique challenges faced by older users, reminding us that inclusive design can make technology accessible and engaging for everyone.
Signal: Intuitive Dashboard Design for Privacy-Focused Apps
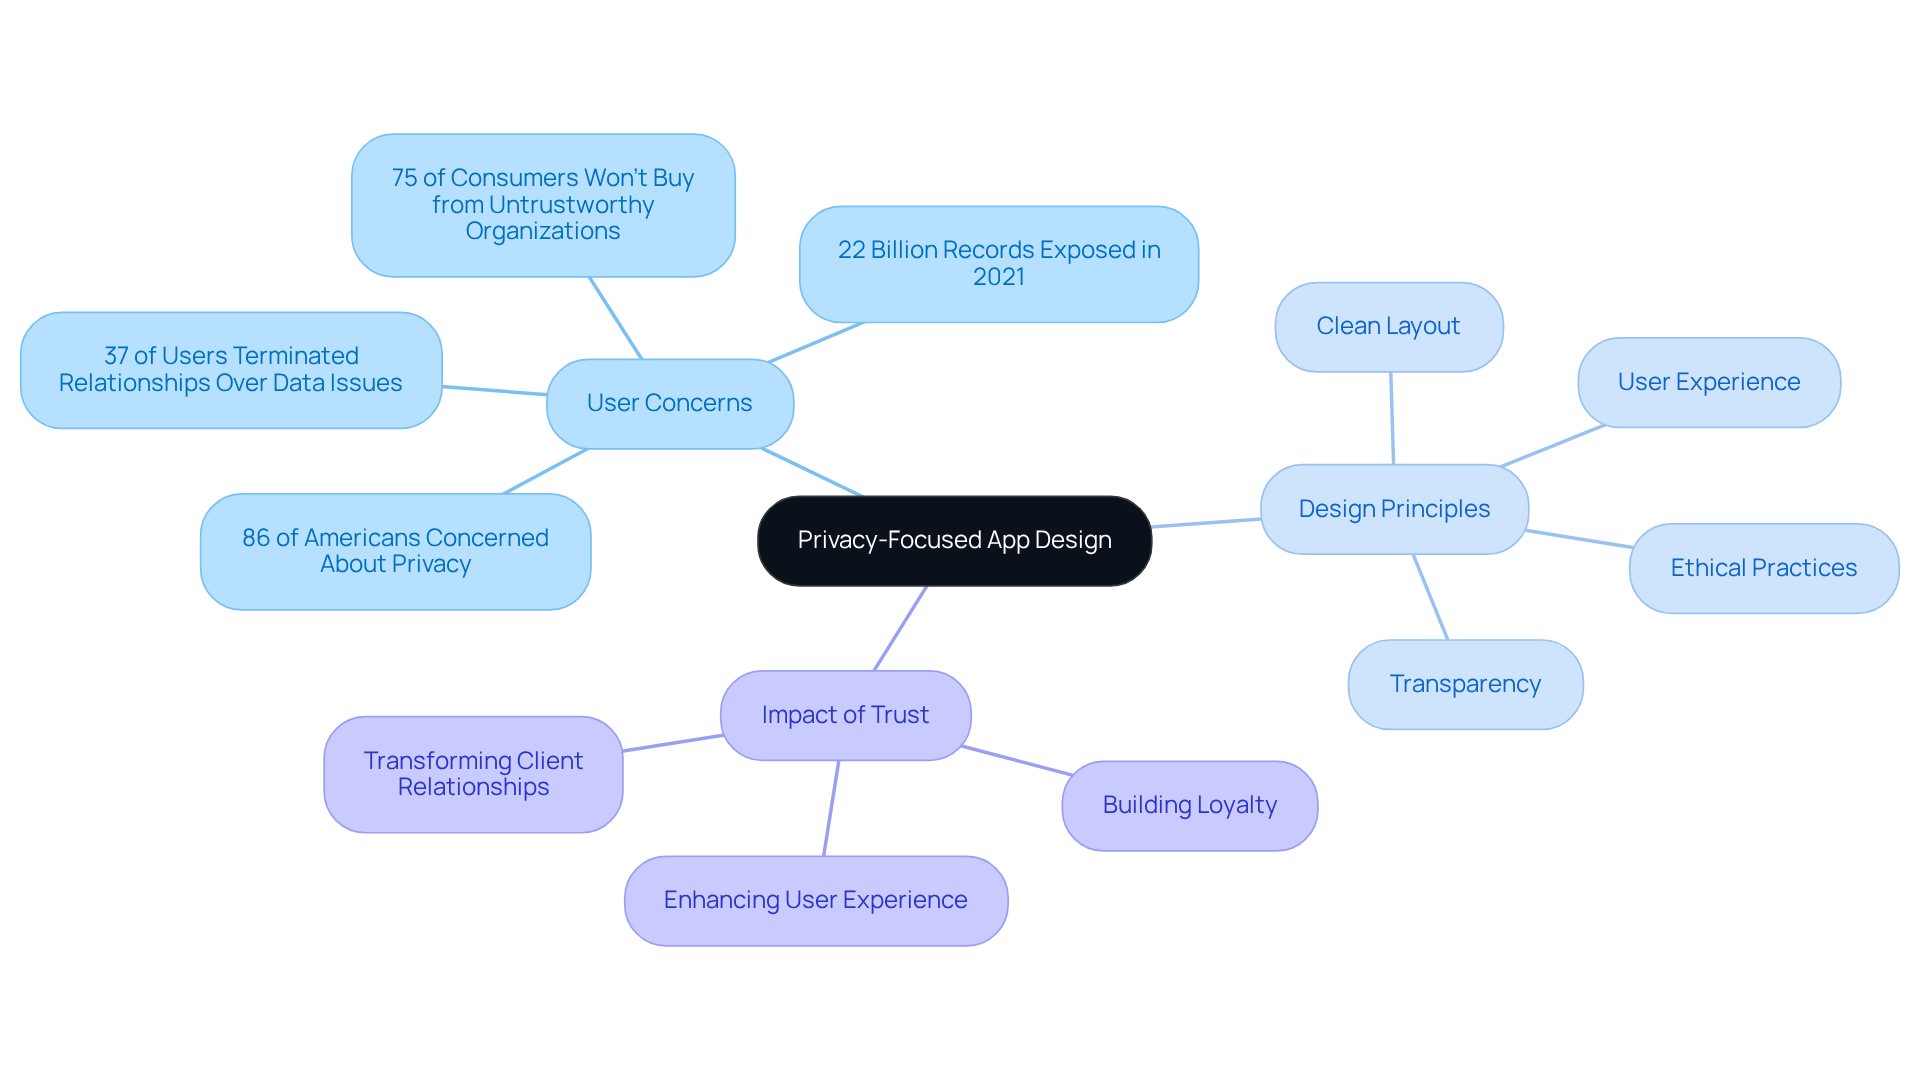
In a world where privacy concerns loom large, how can startups ensure their clients feel safe and valued? Signal's dashboard shows how much they care about your privacy while making it easy for you to use. With a clean layout, it allows you to find what you need without any distractions. By putting your security first and making sure you have a great experience, Signal not only enhances usability but also builds trust - a crucial element in today’s digital landscape.
It's no wonder many users feel anxious about their data being mishandled, which can leave them feeling vulnerable. With 86% of Americans expressing concerns about privacy, the need for designs that prioritize trust and ethical practices is more important than ever. Furthermore, with 22 billion records exposed through breaches in 2021, the risks linked to insufficient privacy measures are clear.
Startups can learn valuable lessons from Signal's approach, especially in the dashboard examples design that reflects a dedication to privacy and transparency. When startups embrace these principles, they can create a safe space that builds loyalty and trust with their clients. Remember, 75% of consumers won’t buy from organizations they don’t trust with their personal information. Ultimately, prioritizing trust can transform client relationships and lead to lasting success.
Matomo: Privacy-Centric Analytics Dashboard Design
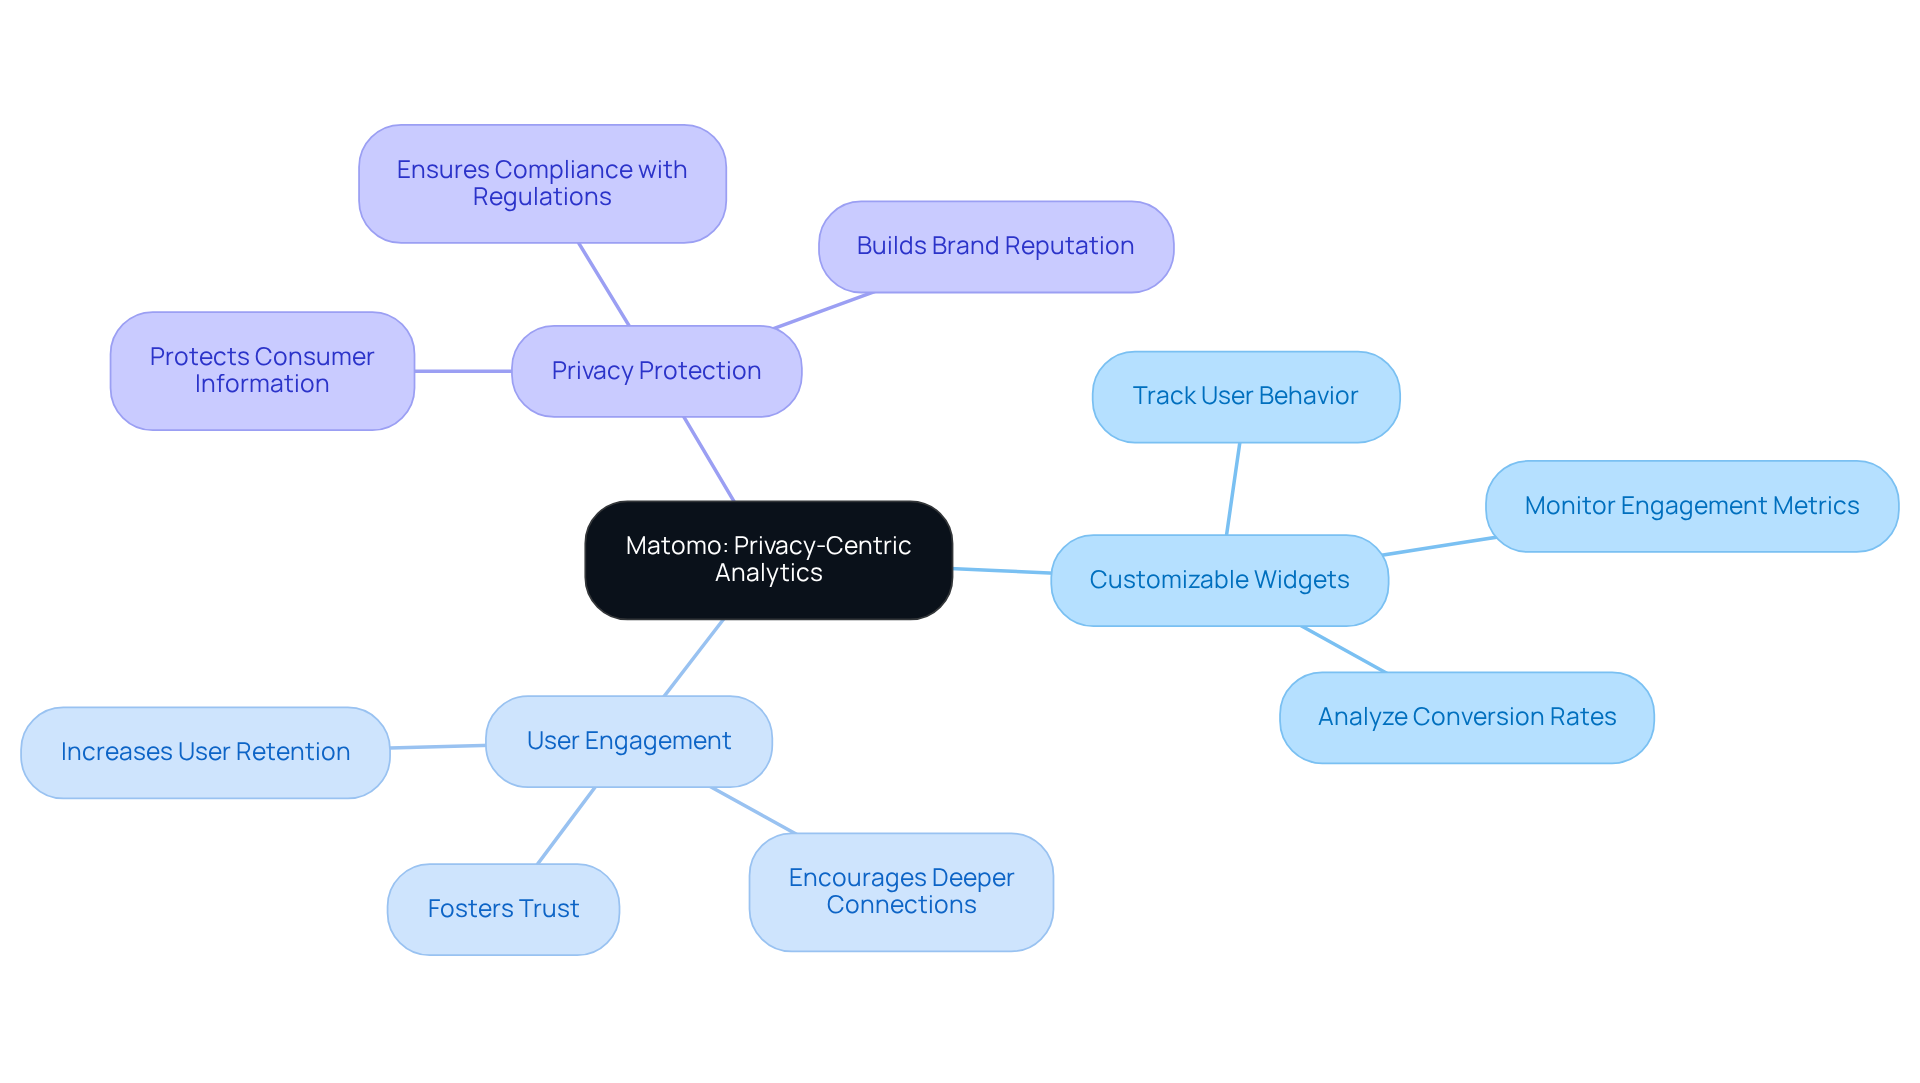
In a world where data breaches are all too common, startup founders often feel anxious about protecting their users' information. Imagine having an analytics tool that not only respects your users' privacy but also empowers you to make informed decisions. Matomo offers just that.
With customizable widgets, you can easily track the metrics that matter most to your startup, all while ensuring your users feel secure. When you prioritize privacy, you create a safe space that encourages your users to engage more deeply with your platform.
By adopting Matomo's approach, you can build an analytics interface that not only protects consumer information but also offers insights that drive your startup's success.
Mercury: Simplified Financial Dashboard for Startups
Navigating the financial landscape can feel daunting for many startup founders, often leaving them anxious about their company's future. Mercury's dashboard examples design provides a streamlined approach to managing essential financial metrics, helping to ease that burden. Its intuitive interface allows users to monitor cash flow, expenses, and revenue in real-time, ensuring that critical financial data is presented clearly and concisely. This design philosophy is vital for startups aiming to maintain financial health and adapt their strategies swiftly, particularly in the context of dashboard examples design in a dynamic market.
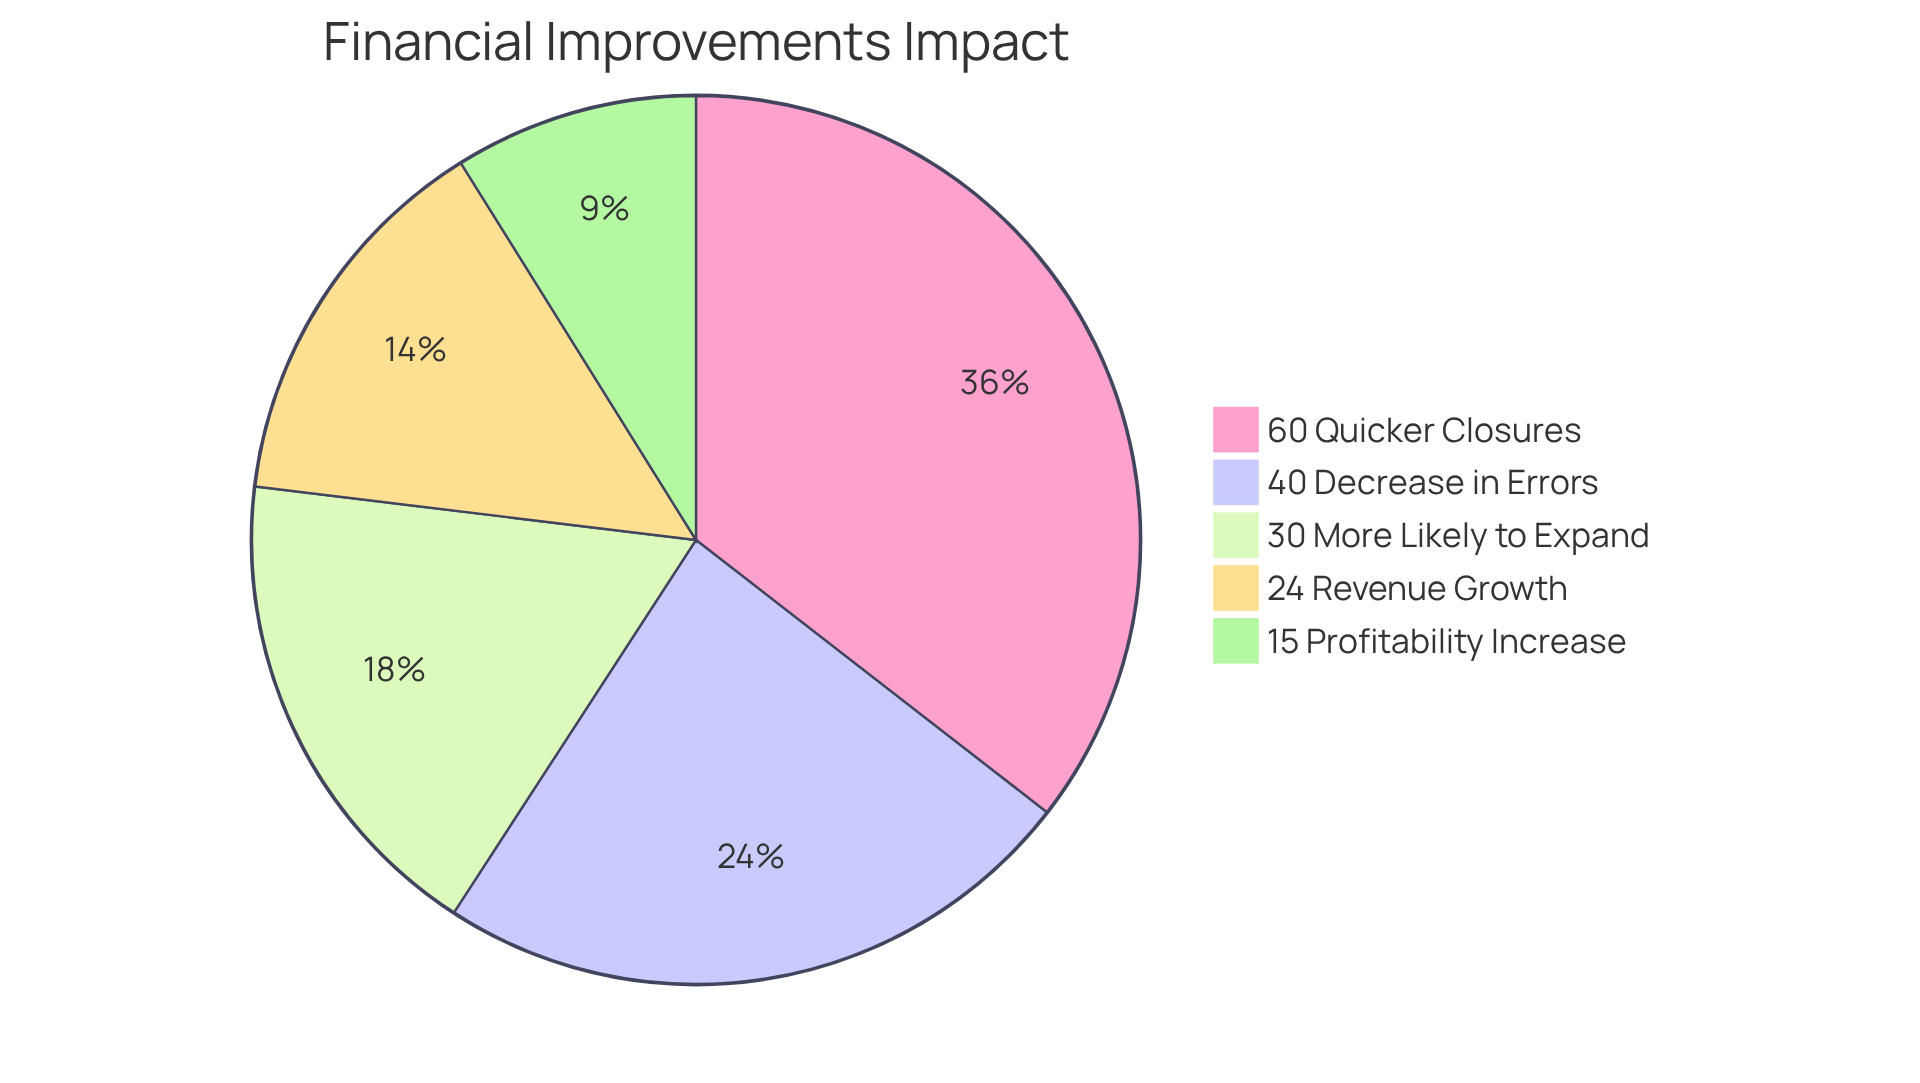
I've seen firsthand how companies that use visual tools make decisions faster and with more confidence. Statistics show that businesses that consistently assess their financial metrics are 30% more likely to expand. Moreover, real-time insights can lead to a 24% increase in revenue growth, highlighting the strong connection between effective visual analytics and financial success. One startup I worked with saw their profitability soar by 15% in just a year after they embraced a real-time analytics tool, a testament to the power of informed decision-making.
Furthermore, startups utilizing AI-driven financial tools report notable enhancements, including 60% quicker monthly closures and a 40% decrease in accounting mistakes. By empowering startups with immediate access to their financial health, Mercury fosters informed decision-making and strategic agility, essential for navigating the challenges of growth and investor expectations. As one industry expert put it, 'A financial interface is one of the most effective tools a founder has to build a resilient, high-growth business.' This really resonates with me, as I've seen it make a difference for many founders.
GitHub Pulse: Developer-Focused Dashboard Design
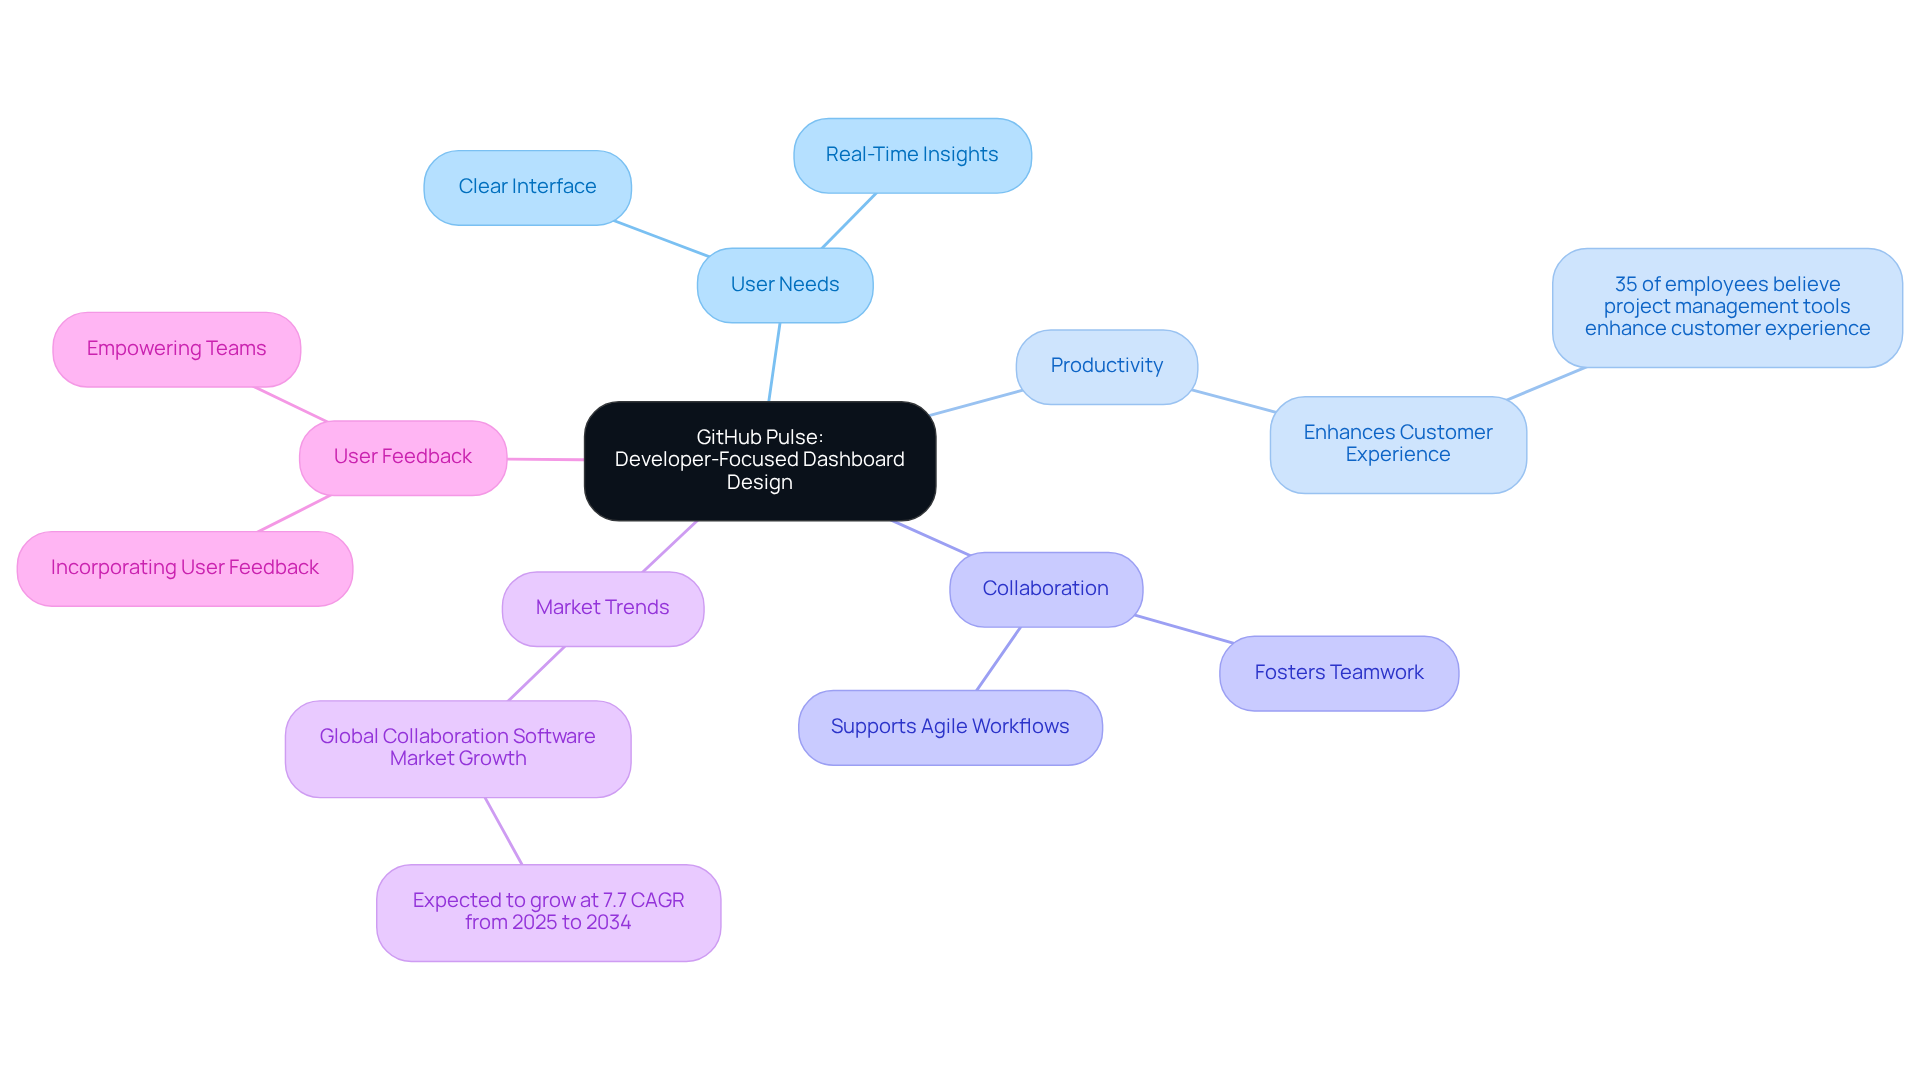
Have you ever felt overwhelmed by project management tools that just don’t seem to fit your team’s needs? GitHub Pulse is here to change that. Imagine a tool that truly understands your team’s challenges - GitHub Pulse does just that, offering a clear and accessible interface that makes it easy for teams to track project activity and performance metrics. By focusing on what developers really need, GitHub Pulse not only boosts productivity but also creates a sense of teamwork and collaboration.
Research shows that 35% of employees believe project management tools enhance customer experience. This highlights how crucial it is to create interfaces that resonate with users. GitHub Pulse provides real-time insights into contributions and pull requests, aligning perfectly with the growing demand for tools that support agile workflows. As you work to create interfaces that fit your clients’ unique workflows, take inspiration from GitHub Pulse’s approach. It simplifies processes while fostering a collaborative atmosphere that’s vital for innovation.
The tech sector is evolving, with the global collaboration software market expected to grow at a 7.7% CAGR from 2025 to 2034. This trend underscores the importance of user-focused principles in enhancing engagement and satisfaction among developers. To apply similar principles for your interface creation, focus on incorporating user feedback into your development process. By prioritizing user feedback, you’re not just creating a tool; you’re building a supportive environment that empowers your team to thrive.
ERPNext: Comprehensive Business Dashboard Design
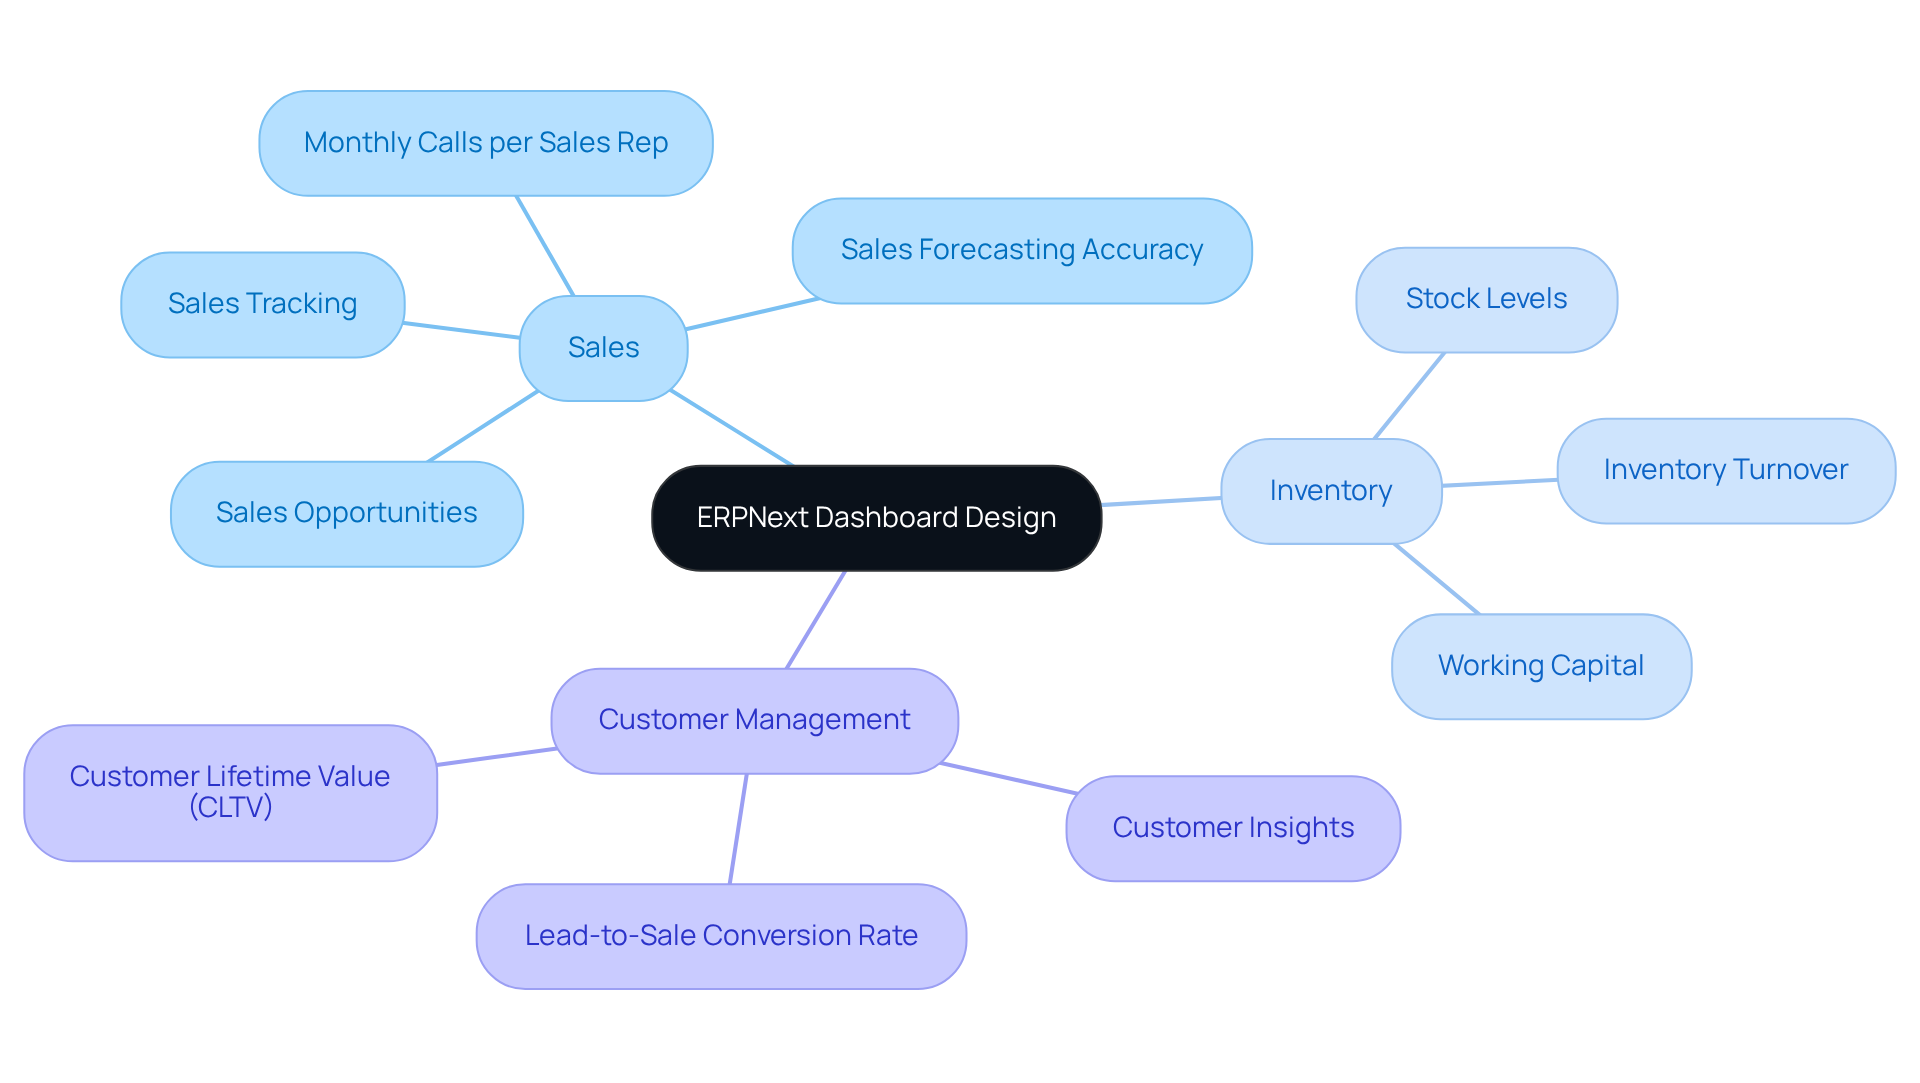
Many startup founders feel overwhelmed by the multitude of tasks they need to manage, often struggling to keep everything organized and efficient. ERPNext offers a comprehensive business dashboard examples design that integrates various functions, including sales, inventory, and customer management. With its all-in-one design, ERPNext helps you keep an eye on your business's vital signs, making it easier to stay on top of everything. By centralizing your data with ERPNext, it becomes much simpler to make informed decisions that can really boost your efficiency.
Startups can gain from this method by developing visual tools, including dashboard examples design, that offer a comprehensive perspective on their business performance, turning that chaos into clarity and empowering you to focus on what truly matters - growing your business and serving your customers.
Umami: Simple and Effective Web Analytics Dashboard Design
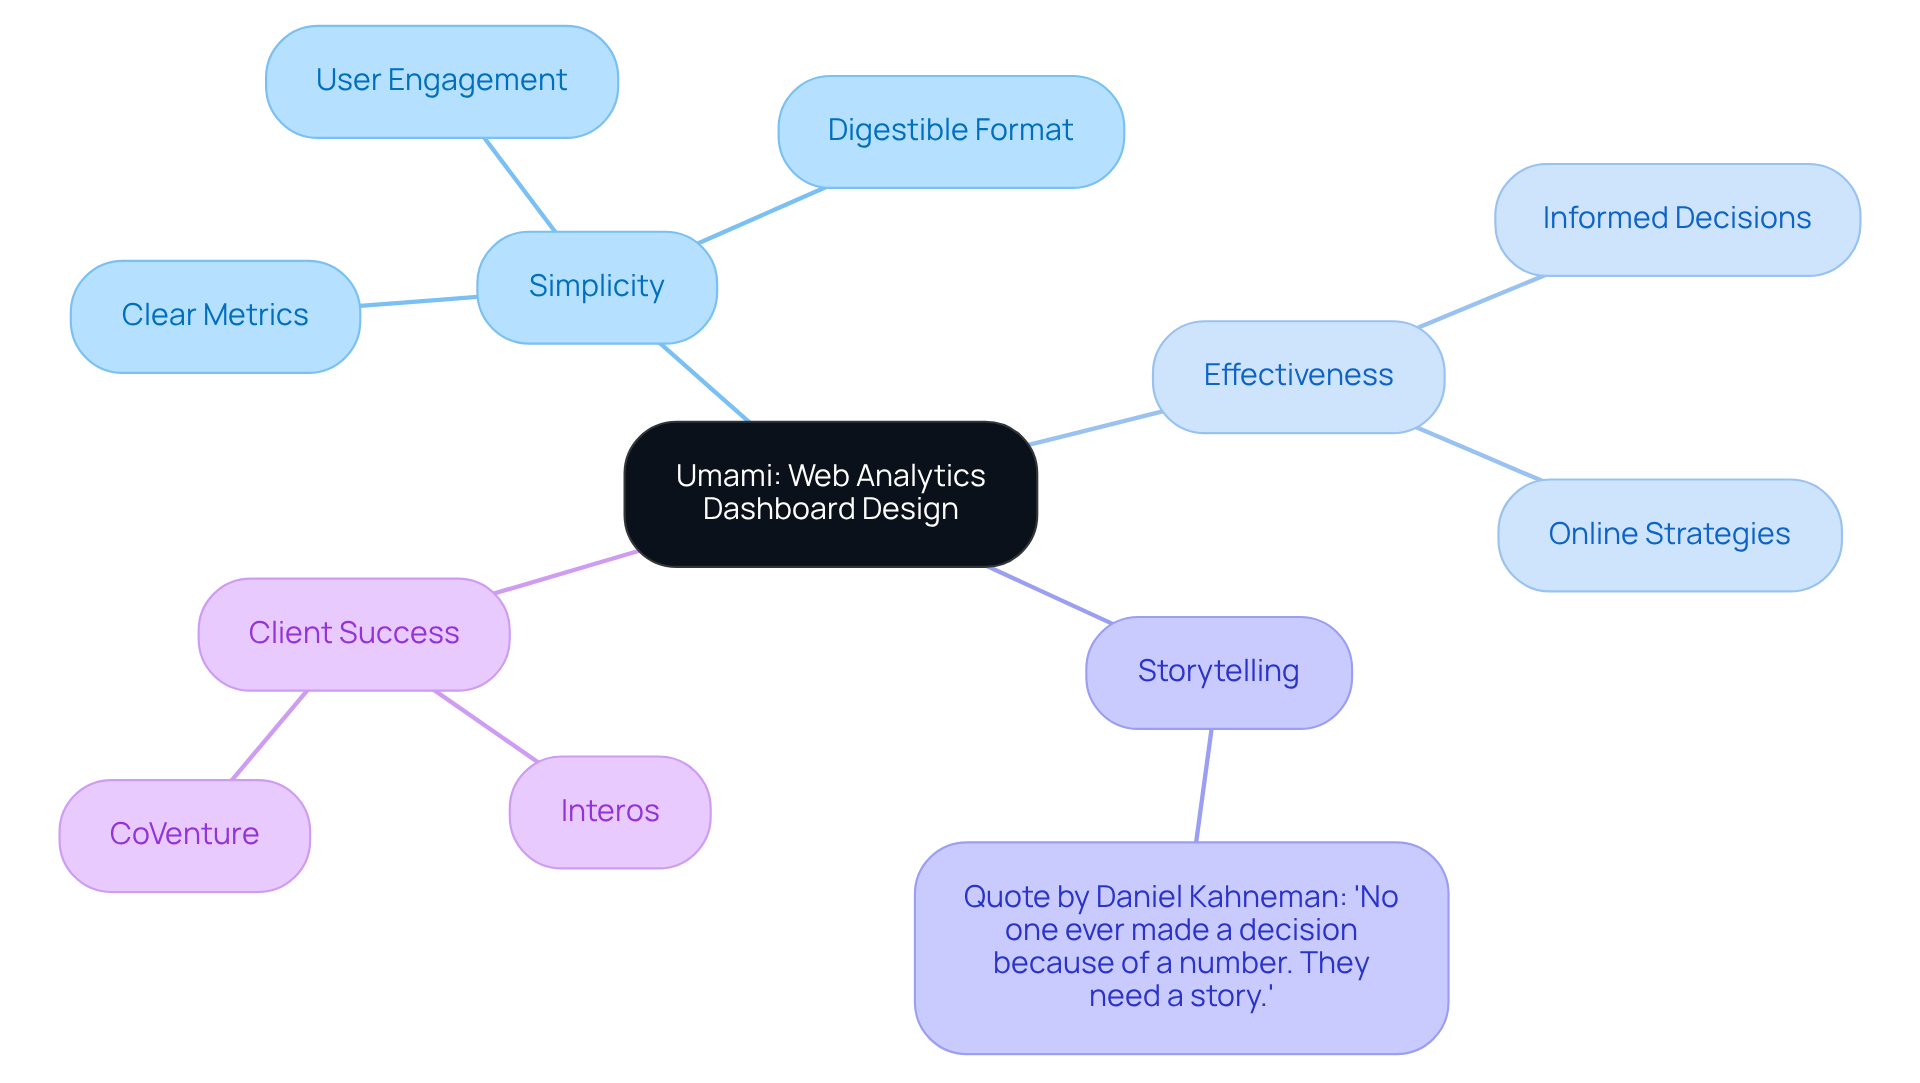
Many startups struggle to make sense of overwhelming data and complex analytics, often feeling lost in the numbers. Umami's web analytics interface is a prime example of a dashboard examples design that prioritizes simplicity and effectiveness in presenting website performance metrics. By presenting crucial data such as visitor counts, traffic sources, and behavior patterns in a clear and digestible format, Umami enables startups to make informed decisions regarding their online strategies. This approach makes it easier for users to engage with the data, reflecting a growing trend towards simplicity in design.
At RNO1, we believe that working together leads to real success, and we’re here to help you every step of the way. Our expertise in UX/UI and AI-enhanced digital marketing has assisted clients like Interos and CoVenture in achieving significant enhancements in user interaction and satisfaction.
As startups navigate the complexities of digital landscapes, adopting straightforward yet impactful visual designs, including dashboard examples design, can be a game-changer in optimizing their web analytics capabilities. To further enhance effectiveness, startups should consider integrating storytelling elements into their dashboards, as Daniel Kahneman noted, 'No one ever made a decision because of a number. They need a story.' Embracing storytelling in analytics can turn confusion into clarity, empowering startups to make decisions that truly resonate.
Conclusion
Many startups find it challenging to make sense of overwhelming data, leading to missed opportunities and confusion. RNO1's exploration of inspiring dashboard design examples for tech startups reveals how user-centric design can truly enhance engagement and decision-making. By focusing on clarity, usability, and actionable insights, we’re here to help startups turn complex data into intuitive interfaces that resonate with users. This nurturing approach not only fosters brand loyalty but also positions businesses for sustained growth in a competitive landscape.
Throughout this journey, we’ve seen various dashboard solutions, including Grafana, Kibana, and Odoo, illustrate how tailored designs can meet the unique needs of startups. Each example underscores the importance of integrating user feedback and prioritizing simplicity to create effective analytics tools. Moreover, the case studies of clients like Interos and CoVenture demonstrate our commitment to delivering transformative digital experiences that drive success.
In a world where data-driven decisions are paramount, embracing innovative dashboard design is essential for startups aiming to thrive. When startups prioritize user-centric design, they not only enhance their decision-making but also build lasting relationships with their users, paving the way for future success. The journey towards creating impactful dashboards begins with a commitment to understanding user needs and crafting experiences that empower them to make informed choices.
Frequently Asked Questions
Why is effective dashboard design important for user engagement?
Effective dashboard design is crucial because 88% of users are unlikely to return after a negative experience. A well-designed interface enhances user engagement and retention by providing clarity and actionable insights.
How does RNO1 approach dashboard design?
RNO1 merges advanced UX principles with a strong focus on usability, emphasizing clarity, visual hierarchy, and actionable insights to empower users in navigating complex data landscapes.
Can you provide examples of RNO1's successful projects?
Notable projects by RNO1 include collaborations with Interos and CoVenture, showcasing tailored solutions that meet the distinct needs of both tech startups and established enterprises.
What impact does prioritizing user experience have on business performance?
Organizations that prioritize user experience have been shown to exceed the S&P by 228% from 2004 to 2014, indicating that innovative UX approaches contribute significantly to business success.
What is the philosophy behind RNO1's design solutions?
RNO1's philosophy focuses on transforming user experiences into powerful tools that not only retain clients but also build lasting loyalty through design-driven solutions and 'Radical Digital Experiences™'.
How does Plausible enhance user experience in analytics?
Plausible's analytics interface is designed for simplicity, allowing users to navigate effortlessly and grasp essential insights quickly, reducing confusion and enhancing decision-making.
What does Edward Tufte emphasize regarding information presentation?
Edward Tufte emphasizes that clarity in information presentation is crucial, as poor design can lead to frustration rather than understanding.
How does Grafana support startups in dashboard customization?
Grafana provides customizable dashboards with a broad array of plugins and data sources, allowing startups to create visualizations that accurately represent their unique metrics and KPIs, fostering a collaborative environment.
Why is adaptability important for startups using dashboards?
Adaptability is crucial for startups due to the rapid pace of change in customer expectations. Tools like Grafana enable businesses to modify their interfaces swiftly to meet evolving requirements.
How can Grafana help startups turn insights into action?
Grafana helps startups transform their data into actionable insights, establishing itself as a trusted partner in navigating the intricacies of data visualization and driving innovation.
List of Sources
- RNO1: Transformative Dashboard Design for Modern Brands
- 40+ UX Statistics (from 200,000 hours of UX Research) (https://baymard.com/blog/ux-statistics)
- 50+ UX Statistics To Convince Stakeholders 2025 (https://uxcam.com/blog/ux-statistics)
- Predictive Modeling & AI Decision Support for Healthcare | Intechnic (https://intechnic.com/blog/100-ux-design-quotes-to-inspire-and-motivate-you)
- Top 10 Data Visualization Quotes From Tufte, Shneiderman & More (https://fusioncharts.com/blog/best-data-visualization-quotes)
- Plausible: User-Friendly Analytics Dashboard Design
- Dashboard Design Principles & Best Practices To Enhance Your Data Analysis | Fireart Studio (https://fireart.studio/blog/dashboard-design-best-practices)
- 100 Essential Data Storytelling Quotes (https://effectivedatastorytelling.com/post/100-essential-data-storytelling-quotes)
- 20 best data visualization quotes - The Data Literacy Project (https://thedataliteracyproject.org/20-best-data-visualization-quotes)
- Learn 25 Dashboard Design Principles & BI Best Practices (https://rib-software.com/en/blogs/bi-dashboard-design-principles-best-practices)
- Grafana: Customizable Dashboards for Data Visualization
- How Personalization Improves App Engagement | Adalo (https://adalo.com/posts/personalization-improves-app-engagement)
- Dashboard Software Market Report, Industry and Market Size & Revenue, Share, Forecast 2024–2030 (https://strategicmarketresearch.com/market-report/dashboard-software-market)
- 45 Dashboard Statistics Every SaaS Should Know In 2025 (https://luzmo.com/blog/dashboard-statistics)
- 20 best data visualization quotes - The Data Literacy Project (https://thedataliteracyproject.org/20-best-data-visualization-quotes)
- Kibana: Visualizing Data with Stunning Dashboards
- My favorite quotes about data visualization: 1. "Perfection (https://linkedin.com/posts/anhleimer_data-datavisualization-dataanalytics-activity-7219767361975816192-aBnZ)
- 50 Data Visualization Statistics That Prove Its Importance in 2026 (https://visme.co/blog/data-visualization-statistics)
- 30 vital key data visualisation effectiveness stats | Embryo (https://embryo.com/blog/data-visualisation-effectiveness-stats)
- 20 Data Visualization Quotes by Industry Experts (https://coresignal.com/blog/data-visualization-quotes)
- 90 Data Visualization Statistics: Brain Processing and More (https://linearity.io/blog/data-visualization-statistics)
- Odoo: Integrated Business Dashboards for Enhanced Functionality
- Big Data-Driven Operational Efficiency for Enterprise Financial Sharing Centers: (https://sciencedirect.com/org/science/article/pii/S1040162825000333)
- How Integrated Data Improves Financial Dashboards (https://lucid.now/blog/how-integrated-data-improves-financial-dashboards)
- The Impact of Centralized Data on Operational Efficiency (https://intelas.com/the-impact-of-centralized-data-on-operational-efficiency)
- Home Assistant: Smart Home Dashboard Design
- 10 Best IoT Insights and Smart-Home Quotes from Connections 2018 (https://cepro.com/news/10_best_iot_smart_home_parks_associates_connections_2018/5333)
- 25 Examples of Customer Facing Metrics Data Designs in Modern Products - Keen - Event Streaming Platform (https://keen.io/blog/25-examples-of-native-analytics-data-designs-in-modern-products)
- From Data to Decisions: UX Best Practices for Real-Time Performance Dashboard Design :: UXmatters (https://uxmatters.com/mt/archives/2025/08/from-data-to-decisions-ux-best-practices-for-real-time-performance-dashboard-design.php)
- Python Smart Home Dashboard Projects Quotes by Eleanor Sloane (https://goodreads.com/work/quotes/298019139)
- ᐉ IoT Monitoring Dashboard (https://thingsboard.io/monitoring-dashboard)
- Signal: Intuitive Dashboard Design for Privacy-Focused Apps
- Increasing Trust Through Privacy Best Practices (https://cesprivacy.org/increasing-trust-through-privacy-best-practices)
- 30 Quotes on User-Centered Interaction Design (https://design4users.com/30-quotes-on-user-centered-interaction-design)
- 64 Alarming Data Privacy Statistics Businesses Must See in 2026 (https://termly.io/resources/articles/data-privacy-statistics)
- Over 150 data privacy statistics companies need to know about in 2026 (https://usercentrics.com/guides/data-privacy/data-privacy-statistics)
- Data Privacy & Brand Trust Statistics (2026) (https://cdp.com/basics/data-privacy-statistics-brand-trust)
- Matomo: Privacy-Centric Analytics Dashboard Design
- Data Privacy Awareness Month 2024: Roundup of Expert Quotes (https://solutionsreview.com/backup-disaster-recovery/data-privacy-awareness-month-2024-roundup-of-expert-quotes)
- 200+ Data Privacy Statistics: Fines, Laws, and Use Behaviour (https://countly.com/blog/data-privacy-statistics)
- Data Privacy Quotes (41 quotes) (https://goodreads.com/quotes/tag/data-privacy)
- 70+ Data Privacy Statistics You Need to Know in 2026 (https://enzuzo.com/blog/data-privacy-statistics)
- 64 Alarming Data Privacy Statistics Businesses Must See in 2026 (https://termly.io/resources/articles/data-privacy-statistics)
- Mercury: Simplified Financial Dashboard for Startups
- Real-Time Financial Data for Better Decisions (https://lucid.now/blog/real-time-financial-data-better-decisions)
- Ultimate Guide to Financial Dashboards for Startups (https://lucid.now/blog/ultimate-guide-to-financial-dashboards-for-startups)
- XcelerateCFO | Virtual CFO for Ecommerce & Tech Startups (https://xceleratecfo.com/blog/e-commerce-financial-dashboards-what-to-track-for-growth-0)
- Startup Financial Dashboards: Real-Time Metrics That Matter (https://glencoyne.com/topic/financial-health-dashboards)
- GitHub Pulse: Developer-Focused Dashboard Design
- Web Development Quotes for Inspiration | Ramotion Agency (https://ramotion.com/blog/web-development-quotes)
- Workplace Collaboration Statistics to Up Your Team’s Productivity (https://cake.com/blog/workplace-collaboration-statistics)
- 90+ Workplace Collaboration Statistics That Matter in 2026 (https://hireborderless.com/post/workplace-collaboration-statistics)
- 11 quotes for developers (https://orsys.fr/orsys-lemag/en/11-quotes-for-developers)
- Measuring Developer Productivity in the LLM Era (https://medium.com/@yujiisobe/measuring-developer-productivity-in-the-llm-era-b002cc0b5ab4)
- ERPNext: Comprehensive Business Dashboard Design
- Impactful BI dashboards follow these design principles (https://funnel.io/blog/bi-dashboards)
- Top 10 Benefits of ERPNext for Small and Medium Businesses (https://ksolves.com/blog/erpnext/benefits-of-erpnext-for-small-and-medium-businesses)
- Business Analytics Dashboard: Benefits, Examples, and More (https://thoughtspot.com/data-trends/dashboard/business-analytics-dashboard)
- What is the Impact of Using a Business Analytics Dashboard? (https://yellowfinbi.com/blog/what-is-the-impact-of-using-business-analytics-dashboard)
- Umami: Simple and Effective Web Analytics Dashboard Design
- 100 Essential Data Storytelling Quotes (https://effectivedatastorytelling.com/post/100-essential-data-storytelling-quotes)
- Web Analytics Dashboard Examples and Templates | Klipfolio (https://klipfolio.com/dashboards/marketing/web-analytics)
- Web Analytics Dashboard Guide: Top Tools & Build Steps 2026 (https://improvado.io/blog/web-analytics-dashboard)
- Web Analytics Dashboard Examples | Geckoboard (https://geckoboard.com/dashboard-examples/marketing/web-analytics-dashboard)
- Web Analytics Dashboard: Examples & Tips (https://technologyadvice.com/blog/information-technology/analytics-dashboard)


